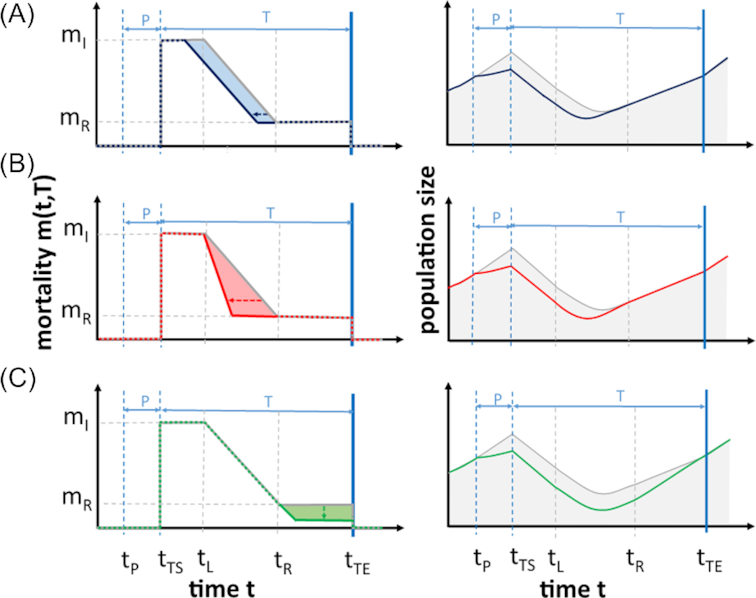
Figure 1.

Potential responses of primed and naïve species toward stress impacts on mortality and the resulting population size. Left panels: Mortality of primed and naïve species, having (A) a stronger, (B) an earlier and (C) a faster response. Right panels: the respective population dynamics. In all panels, the naïve stress response is represented by the gray line, and the colored line represents the primed response. Priming costs are not illustrated here, as they do not affect mortality. Abbreviations:  = priming;
  = triggering;
  = initial mortality;
  = final mortality level of the stress response;
  = beginning of the priming phase;
  = beginning of the triggering stress;
  = end of the response lag phase;
  = time point when
  has been reached;
  = end of triggering stress.
