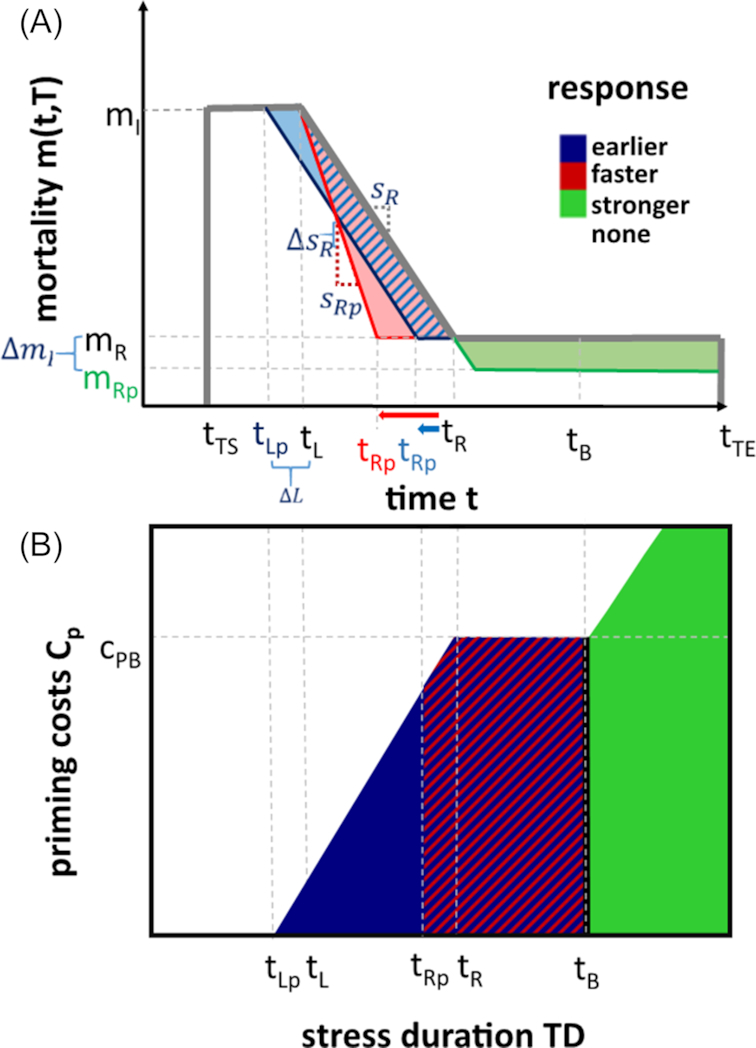
Figure 2.

(A) Mortality reduction of the three strategies and (B) analytically determined parameter space favoring the different primed stress responses under exponential growth depending on stress duration and priming costs. Abbreviations:  = (baseline) priming costs for which the three responses grant a benefit equal to the naïve response;
  = initial mortality;
  = final mortality level of the stress response;
  = primed (reduced)
  (stronger response);
  = beginning of the triggering stress;
  = end of the response lag phase;
  = end of the primed (shorter) response lag phase (earlier response);
  = time point when
  has been reached;
  = time point when
  has been reached with an earlier or faster stress response;
  = (baseline) stress duration when the three responses grant a benefit equal to the naïve response;
  = end of triggering stress;
  = slope of the mortality reduction;
  = primed (higher) slope of the mortality reduction (faster response)
