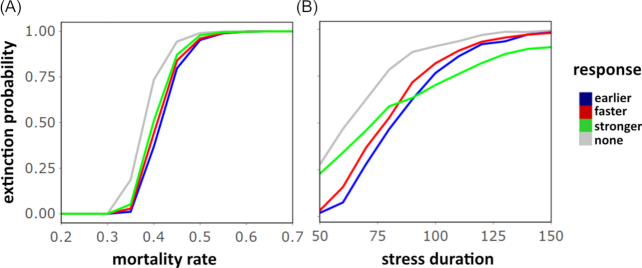
Figure 3.
Extinction probability of a population following no or one of the three primed response strategies under (A) different stress intensities with stress duration  or (B) different stress durations with stress intensity
  . The extinction probability is approximated by the fraction of 10 000 populations that did not survive until
  (end of stress).

