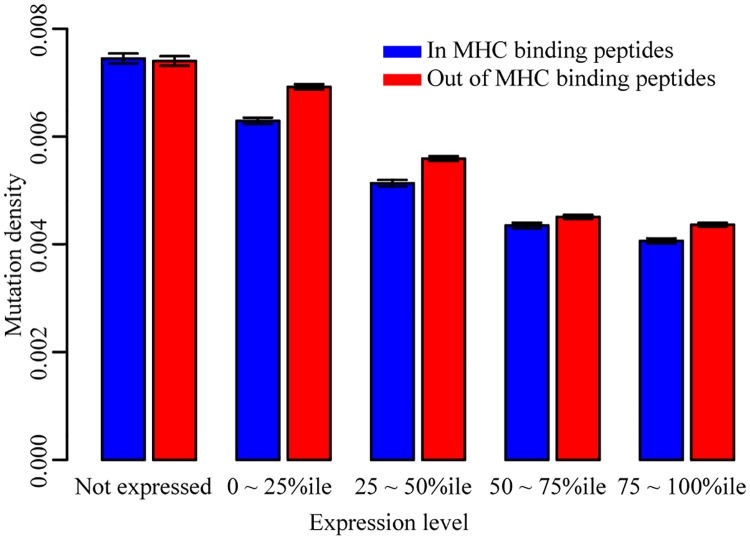
Fig 1. MHC-display-dependent mutation densities for genes with different expression levels.
Blue bars are the mutation density within the predicted MHC binding peptides. Red bars are the mutation density out of the predicted MHC binding peptides. Mutations were separated into five categories based on the expression levels of their genes.

