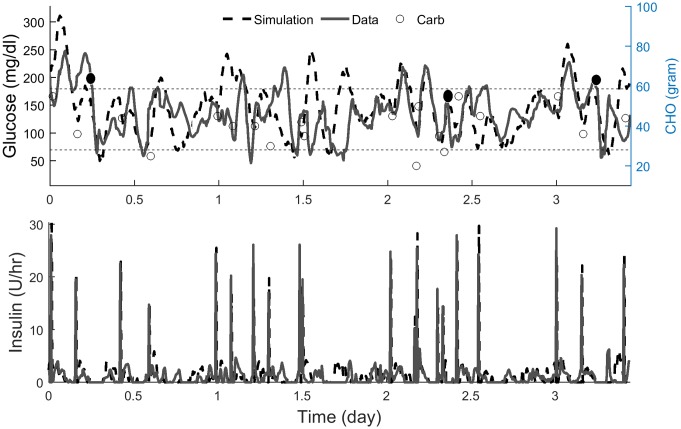
Fig 4. Simulated vs. actual glucose and insulin profiles of one representative subject in single-hormone trial.
Both experiments were initialized at 8:00 am. Carbs are shown with circles. Filled circles show the start of exercise. Higher resolution data from this study is shown in Fig A in S1 File.

