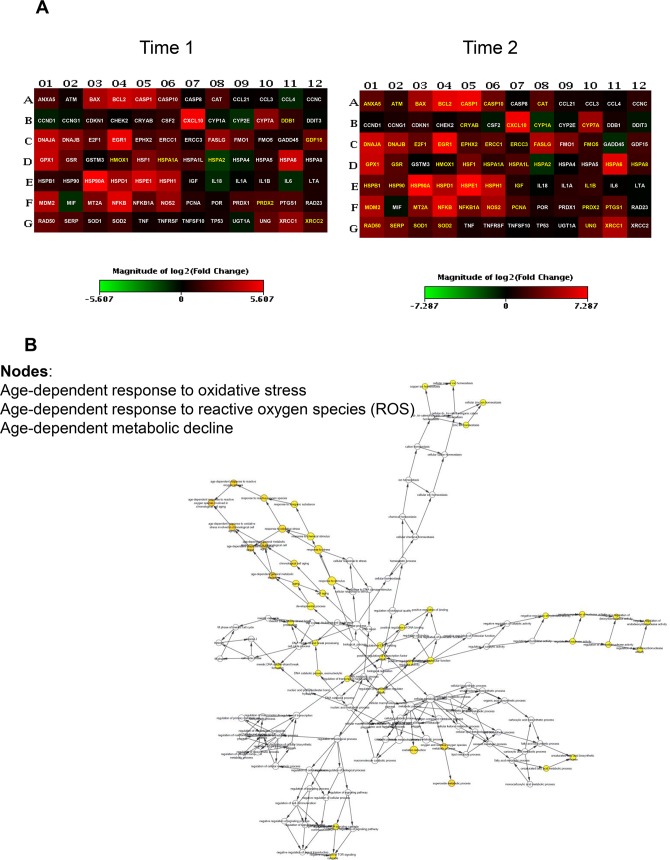
Fig 4. Gene expression analysis in patients receiving integrated anaesthesia (IA).
(A) Heatmap of significant gene expression in PBMCs of patients (n = 3) undergoing elective hip arthroplasty receiving IA, immediately after operation (T1) and on the third postoperative day (T2), adjusted at p-value less than 0.05. Genes with greater and lower abundance after anaesthesia (FC, fold change) are shown in red and green, respectively, with significance highlighted in yellow. Normalization and microarray analysis were performed by RT2 Profiler PCR Array Analysis software version 3.5 (SABiosciences). (B) Gene-gene interaction analysis of the significantly differentially expressed genes showing the networks of deregulated pathways at T2 time point.

