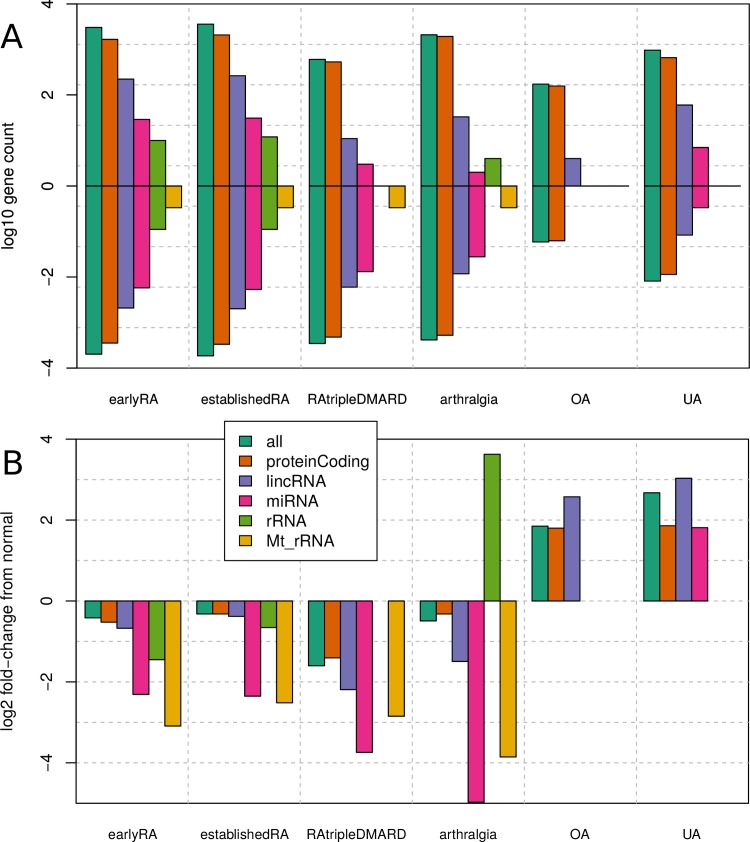
Fig 5. Average fold-changes and counts of different biotypes of genes.
The labels on the x-axis mean the change of this condition relative to normal. Only significant changes are regarded. The labels for the biotypes of genes are defined by Ensembl (the biotypes of genes). Missing bars mean that there was no significant change in any gene of this biotype. (A) The log10 count of the significantly differentially expressed gene by biotype. Each column consists of two bars: from 0 to the positive side are the (log10) numbers of significantly higher expressed genes, from 0 to the negative side are the numbers of significantly lower expressed genes. (B) The average log2 fold-change of the significantly differentially expressed genes. It is to see that the average log2 fold-change roughly corresponds in the difference of the counts of the significantly higher and lower expressed genes. Number of samples: 10 arthralgia, 57 earlyRA, 95 establishedRA, 27 normal, 22 OA, 19 RAtripleDMARD and 6 UA.

