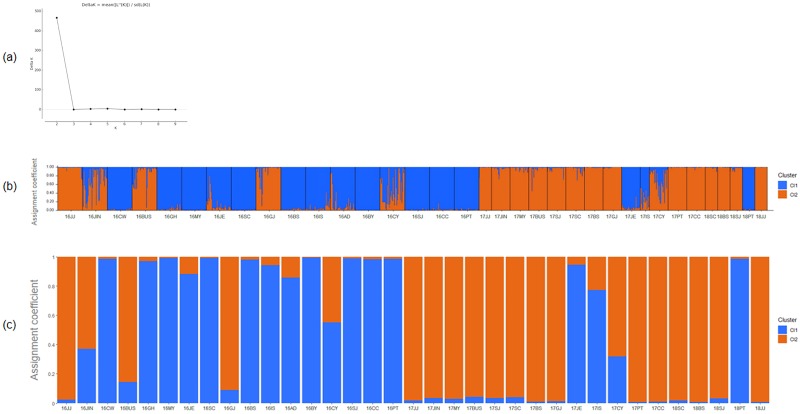
Fig 2. Scatter plots of ΔK = 2.
(a) The maximum value among the genotypes was 466.35 at ΔK = 2, using ΔK = m(|L“K|) / s[L(K)]. Bar plot of the population structure for B. tabaci from 35 populations in Korea (b) using STRUCTURE v.2.3.2 and (c) R software v.3.5.1. Each population is represented by a vertical line with different colors representing the probabilities assigned to each of the genetic clusters.

