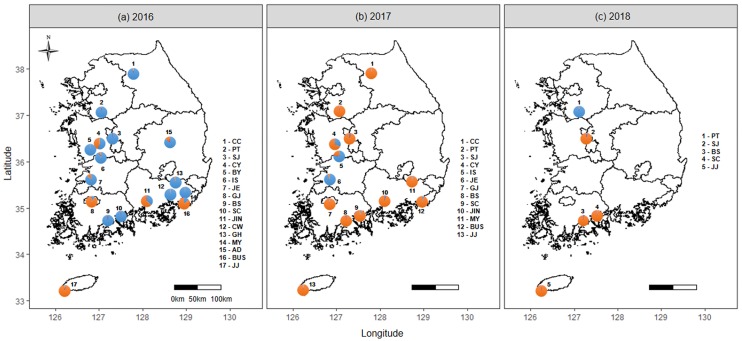
Fig 3. Bayesian clustering results from the structure for all samples (K = 2).
The geographical distribution of the population and the genetic structure of the B. tabaci MED in Korea revealed by STRUCTURE analysis in samples from (a) 2016, (b) 2017, and (c) 2018. Genetic changes were observed in six of the populations from 2016 to 2017. The maps were created by using the R software v.3.5.1.

