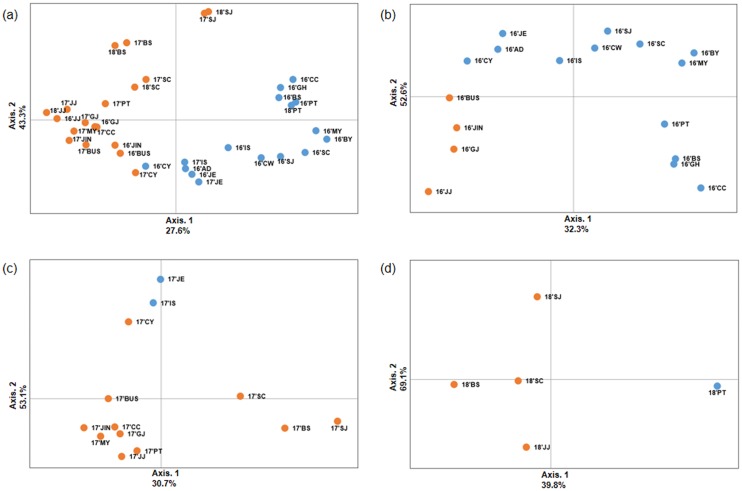
Fig 4. Principal component analysis (PCoA) plotting the relationships of 35 B. tabaci MED population samples.
Each axis indicates the percentage of the total variations. STRUCTURE with marked color is the same as one of Bayesian clustering (blue and orange colors) from (a) 2016–2018, (b) 2016, (c) 2017, and (d) 2018.

