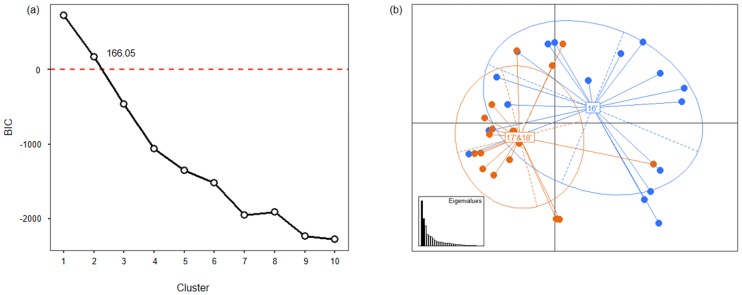
Fig 5. Discriminant analysis of principal components (DAPC) analysis of 35 B. tabaci MED populations in Korea.
(a) The Bayesian information criteria (BIC) supported two distinct genetic clusters. (b) The eigenvalues of the analysis suggest that the first two components explained the maximum genetic structure of the dataset. Scatter-plot of the distribution of B. tabaci MED formed two genetic clusters (blue and orange colors).

