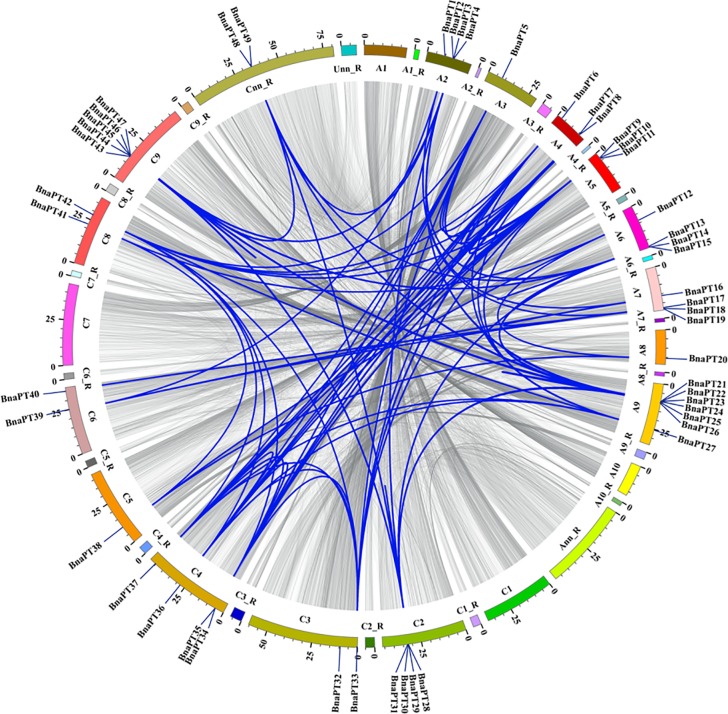
Fig 2. Schematic representations for the chromosomal distribution and interchromosomal relationships of rapeseed PHT1 genes.
Gray lines indicate all syntenic blocks in the Brassica napus genome, and the blue lines indicate syntenic PHT1 gene pairs. The chromosome number is indicated at the bottom of each chromosome. R, random.

