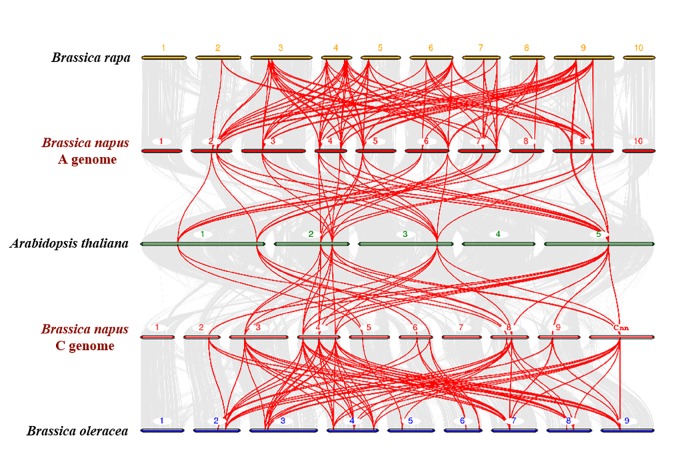
Fig 3. Synteny analysis of PHT1 genes in Brassica napus, B. rapa, B. oleracea and Arabidopsis thaliana chromosomes.
Gray lines in the background indicate the collinear blocks within B. napus and other plant genomes, while the red lines highlight the syntenic PHT1 gene pairs. Genes located on B. napus A genome are syntenic with genes of B. rapa and A. thaliana, while genes located on B. napus C genome are syntenic with genes of B. oleracea and A. thaliana.

