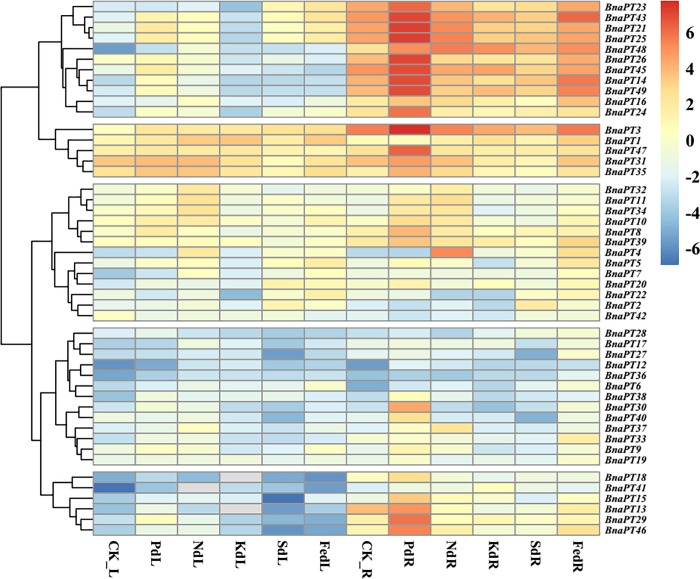
Fig 4. Expression profiles of the PHT1 family genes in the leaves and roots of Brassica napus under various nutrient stress conditions.
Seedlings of 14 days old were exposed to various nutrient deficiency environments for six days. The fully expanded leaf and roots were sampled separately for RNA extraction. L, leaf. R, roots. CK, full strength Hoagland’s solution. Pd, phosphorus deficiency. Nd, nitrogen deficiency. Kd, potassium deficiency. Sd, sulfur deficiency. Fed, iron deficiency. The color scale is shown on the right side. Gray box indicates data undetected. Heat map of gene expression profiles was generated using pheatmap package in R after data normalization.

