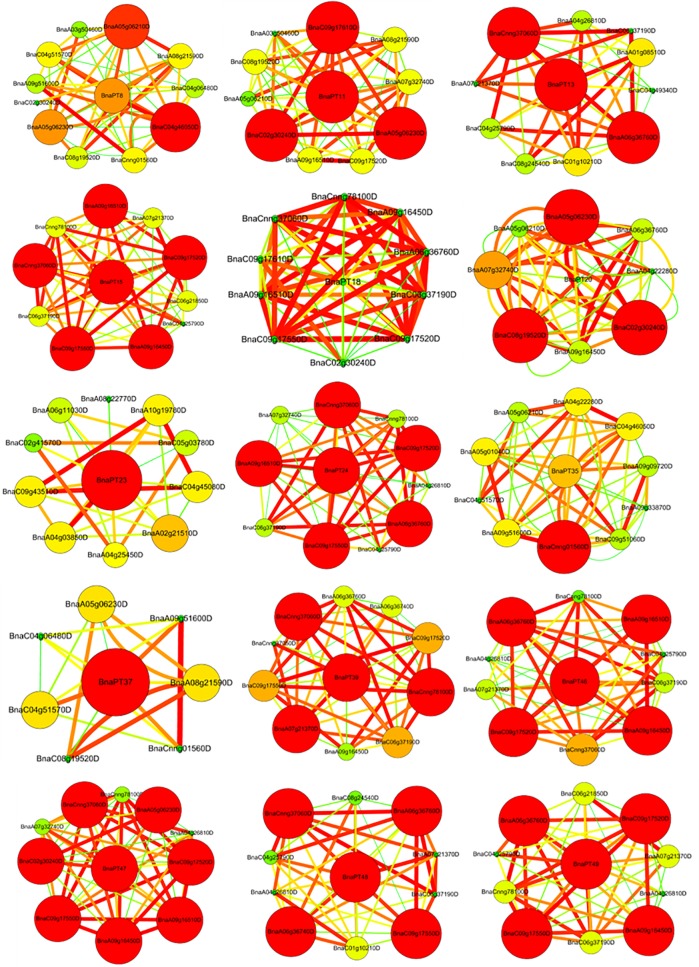
Fig 7. Coexpression networks of 15 PHT1 family genes in Brassica napus.
Cycle nodes represent genes, and the size of the nodes represents the power of the interrelation among the nodes by degree value. The width of the lines between two nodes represent interactions between genes. The PHT1 family genes located in the center of the network, while the 10 most coexpressed genes were displayed in each network.

