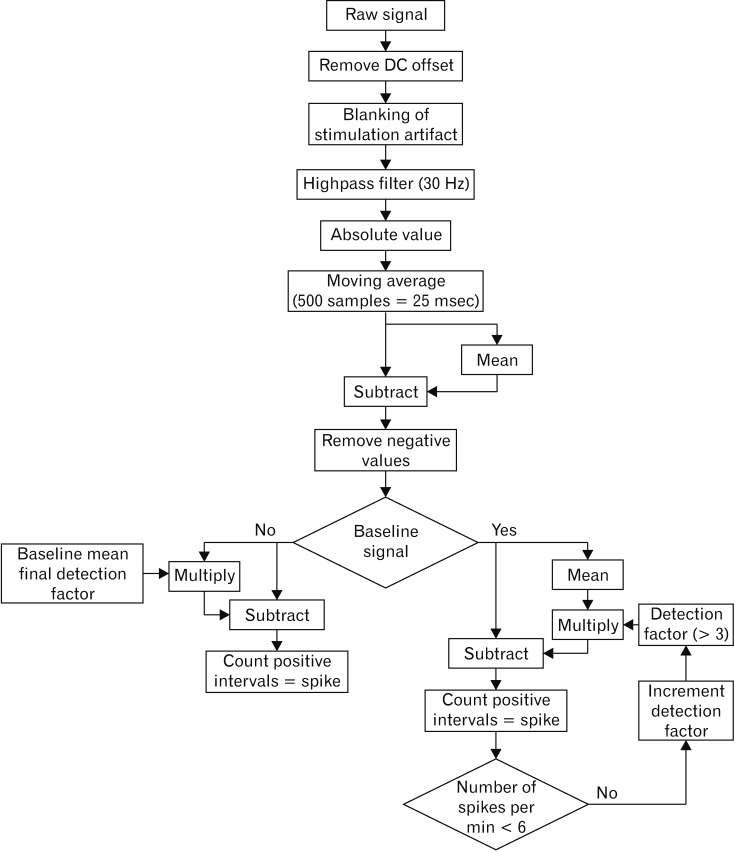
Figure 3.
Spike detection flow chart for automated electromyography (EMG) spike detection. Automated EMG spike detection was computed with analysis of the absolute amplitude. A 30 Hz filter was applied and baseline cutoff values were calculated to reach a level of less than 6 spikes per minute with application of the same cutoff values for the subsequent spike detection in the post-stimulatory periods.

