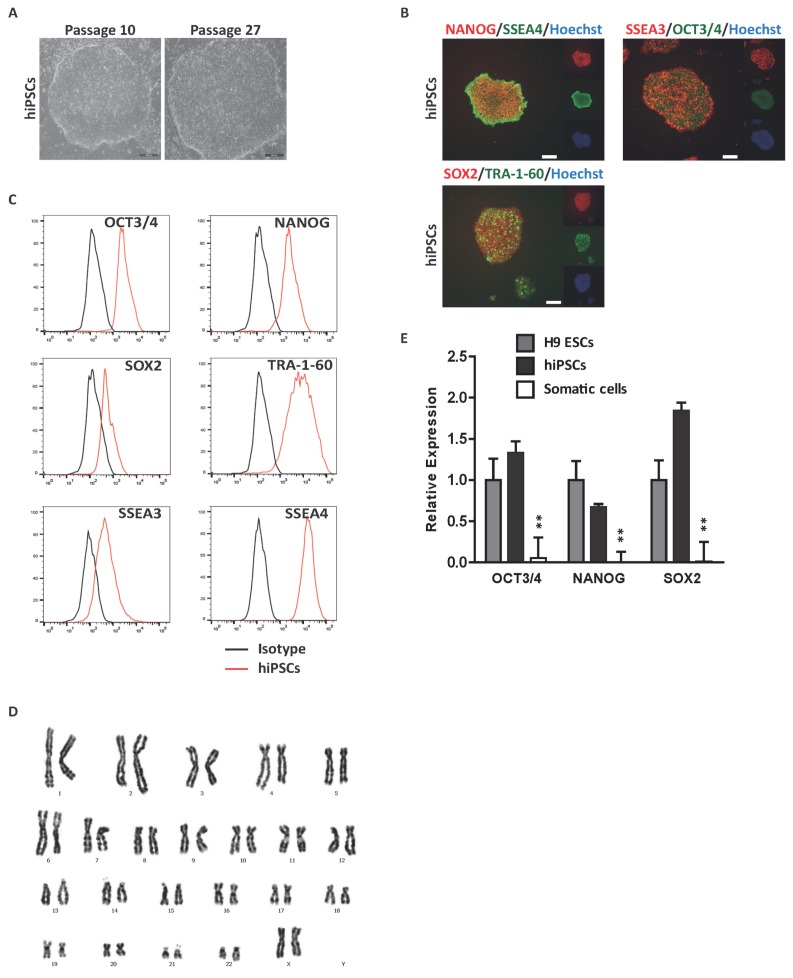
Fig. 1.
Derivation of hiPSCs from BM CD34+ cells. (A) Representative phase-contrast image of hiPSCs. hiPSCs were characterized by embryonic stem cell morphology. Scale bar, 200 μm. (B) Immunocytochemical analysis of pluripotent markers. Representative images of hiPSCs stained with the pluripotent markers OCT3/4, NANOG, SOX2, SSEA3, SSEA4 and TRA-1-60. Scale bar, 200 μm. Nuclei were stained with hoechst33342 (blue). (C) Flow cytometric analysis of pluripotent marker expression. Black histogram bars indicate negative isotype controls. (D) Karyotype analysis of hiPSCs, displaying a normal 44+XX karyotype. (E) Quantitative real-time PCR analysis of pluripotent genes in hiPSCs normalized to GAPDH. #Data are presents as the means±SD of three independent experiments. *p<0.05; **p<0.01.

