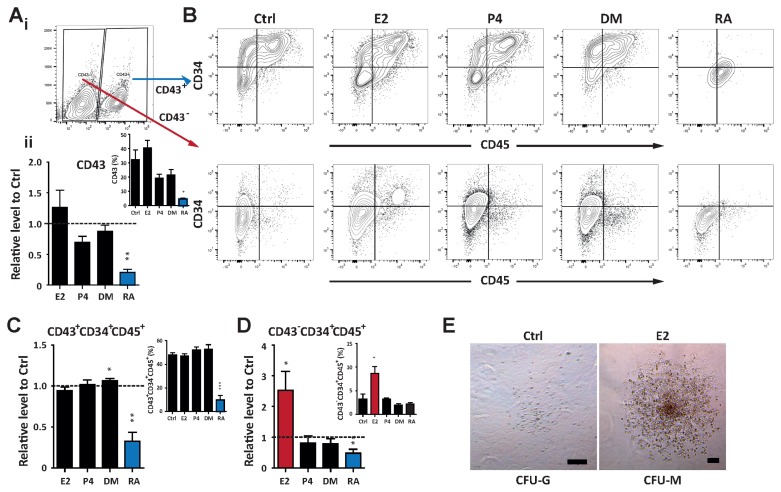
Fig. 3.
E2 enhances the functional ability of hemogenic precursors. (A) i. Flow cytometric analysis identifying the CD43+ population during hematopoietic differentiation. ii. Relative levels of CD43+ cells normalized to the control. The inset shows the percentage of CD43+ cells. (B) Flow cytometry gating of the CD43+ and CD43− fraction to analyze the frequency of hematopoietic progenitors (CD34+CD45+). (C) Relative proportions of hematopoietic progenitors of CD43+ fractions normalized to the control at day 12. The inset represents the percentage of CD34+CD45+ cells. (D) Relative levels of CD34+CD45+ cells gated from the CD43− population normalized to the control. The inset displays the percentage of CD34+CD45+ cells. (E) Representative CFU morphologies derived from the CD43−CD34+CD45+ population treated with E2. Scale bar, 100 μm. #Data are presents as the means±SD of three independent experiments. *p<0.05; **p<0.01.

