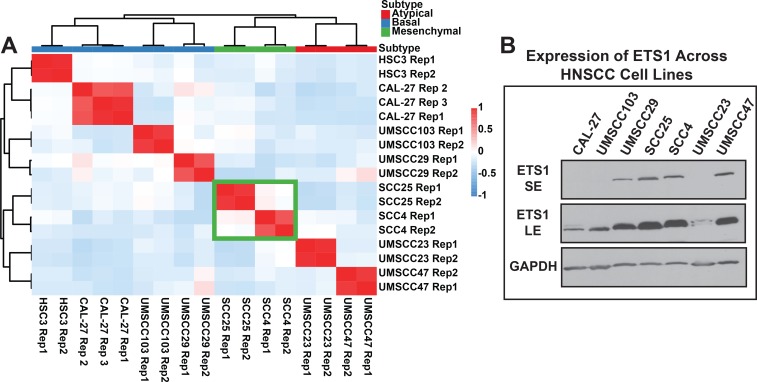
Fig 3. SCC25, a representative HNSCC cell line expresses high levels of ETS1.
(A) Heatmap showing the cross-correlation value of the top 1500 most variably expressed genes in 8 HNSCC cell lines of different subtypes. The correlation matrix was reorganized via hierarchical clustering (Pearson Correlation, complete linkage). The green box highlights the two Mesenchymal classified cell lines, SCC25 and SCC4. (B) Western blot analysis of ETS1 across HNSCC cell lines. SE, short exposure; LE, long exposure; GAPDH, loading control.

