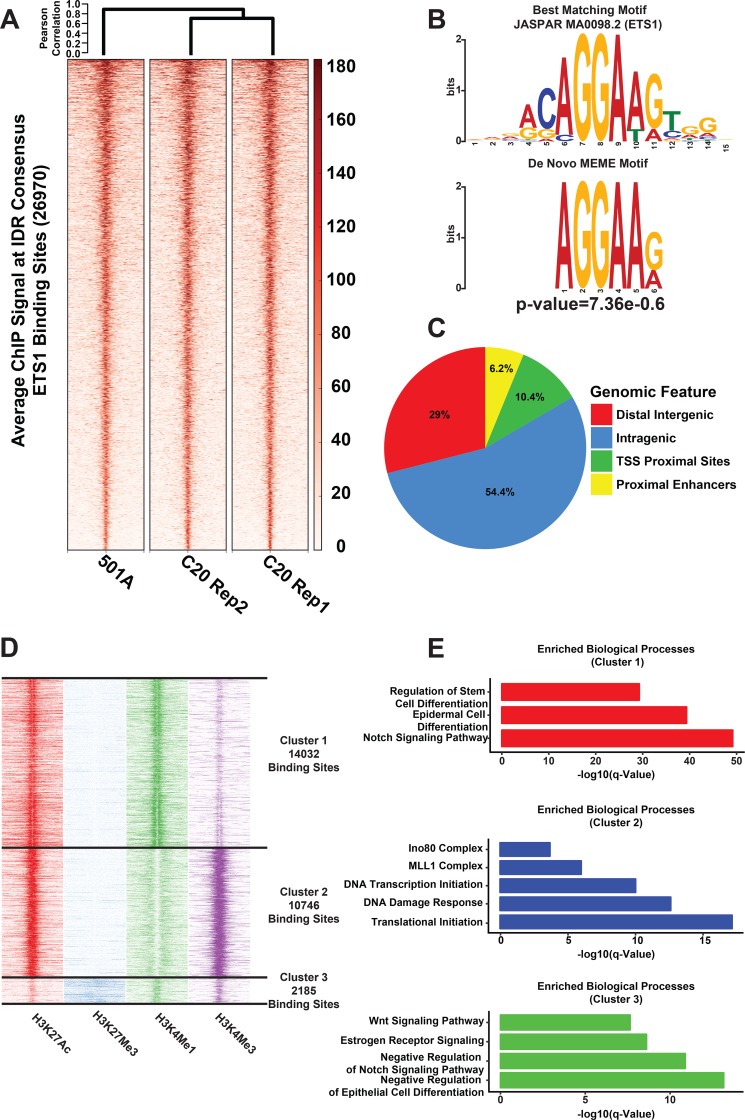
Fig 4. ChIP-Seq analysis reveals direct ETS1 targets and their epigenomic features in SCC25 cells.
(A) Heatmap of the ChIP-Seq signal at the IDR-generated consensus ETS1 binding sites across three ChIP replicates. The individual ChIP-Signal matrices were subjected to hierarchical clustering and presented as a dendrogram (B) The top de novo motif, derived from the ETS1 ChIP-Seq peak-set as generated by MEME. The most similar JASPAR motif (2018 Database) as determined by TOMTOM analysis is shown above the MEME motif. (C) Distribution pattern of ETS1 binding sites across the genome. (D) Heatmap of histone modification signal density using k-means clustering on ETS1 binding sites showing three different groups. (E) Bargraphs displaying selected top enriched gene-sets (GO Biological Processes and MSigDB pathways) associated with genes annotated to 3 clusters of ETS1 ChIP-Seq peaks.

