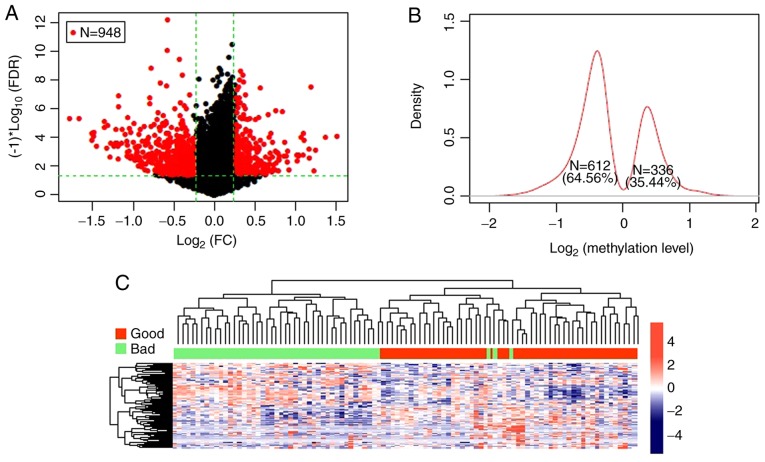
Figure 1.
The significant differentially methylated genes. (A) Volcano plot of significant differentially methylated genes. The red dots represent differentially methylated genes; the black dots represent non-differentially methylated genes; the green horizontal dotted line represents the false discovery rate (FDR) <0.05; the two green vertical dotted lines represent the |log2 fold change (FC)|>0.2. A total of 948 DMGs with CpGs were screened out. (B) Log2 Kernel density curve based on differentially methylated genes. The proportion of hypomethylated genes in the good prognostic group was 64.56% (612/948), and 35.44% (336/948) were significantly hypermethylated. (C) The hierarchical clustering heatmaps of significant differentially methylated genes. The red and green bars represent the samples in good and bad prognostic groups, respectively. The samples were clearly divided into 2 groups based on the screened differentially methylated genes.

