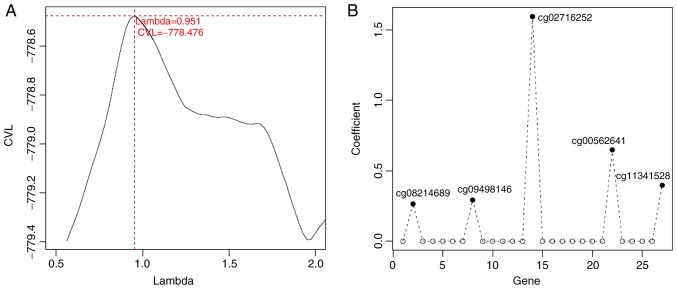
Figure 5.
Identification of optimized prognostic genes through the Cox-Proportional Hazards (Cox-PH) model. (A) The lambda parameter curve selected by cross-validation likelihood. The horizontal and vertical axes respectively represent different values of lambda and cross-validation likelihood. (B) The prognosis coefficients of the 5 optimized prognostic genes (CENPV, TUB, SYTL2, OCLN and CASD1) selected through the Cox-PH model. CENPV, centromere protein V; TUB, Tubby bipartite transcription factor; SYTL2, synaptotagmin like 2; OCLN, occluding; CASD1, CAS1 domain containing 1.

