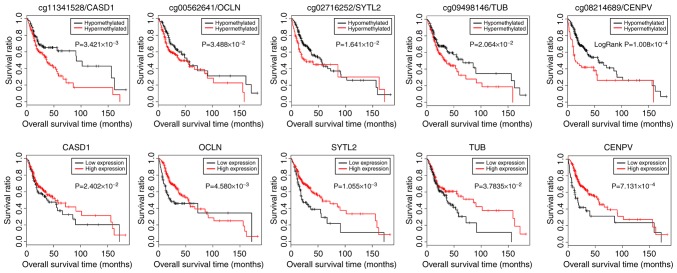
Figure 6.
The Kaplan-Meier curves for patients with different methylation or expression levels of CASD1, OCLN, SYTL2, TUB and CENPV. According to the median of the methylated signal value, the samples were divided into the hypomethylation and hypermethylation groups (upper panels). The KM curves also revealed that the samples with high expression levels had a better overall survival prognosis (lower panels). CENPV, centromere protein V; TUB, Tubby bipartite transcription factor; SYTL2, synaptotagmin like 2; OCLN, occluding; CASD1, CAS1 domain containing 1.

