
Figure 2.
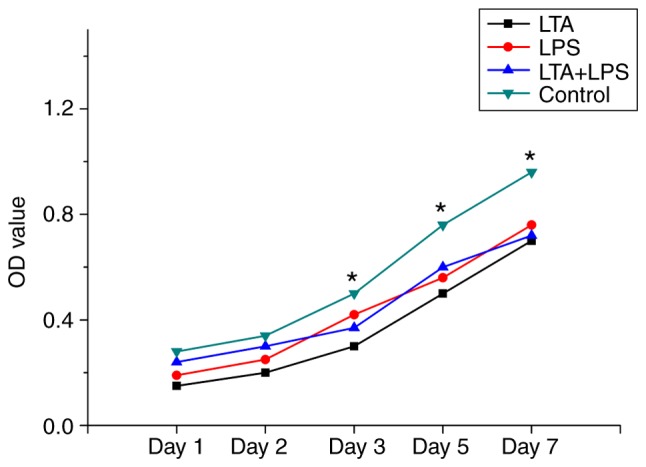
MTT assay. All groups underwent marked proliferation at days 1 and 2. The cell proliferation in LTA and LPS individual and combined groups was weaker than that in the control group. *P<0.05 vs. the LTA group, LPS group, and LTA + LPS group at the corresponding time points. LTA, lipoteichoic acid; LPS, lipopolysaccharide.