
Figure 5.
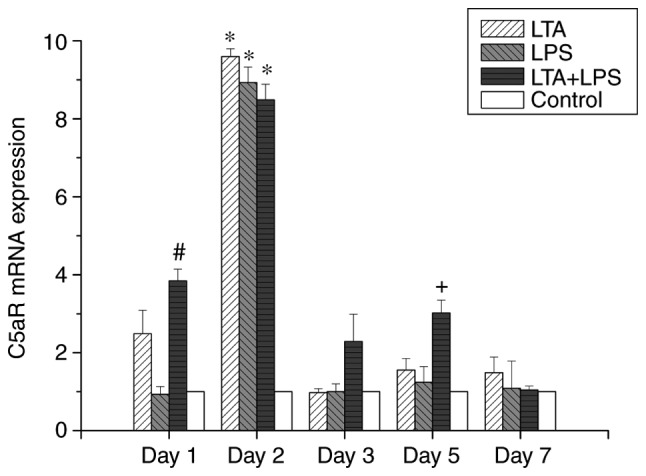
Relative expression levels of complement receptor C5aR mRNA at different time points detected by reverse transcription-quantitative polymerase chain reaction. Values were normalized to actin expression. *P<0.05 vs. the corresponding group at other time points. #P<0.05 vs. the LTA and LPS co-stimulation group (A+S) at days 3 and 7. +P<0.05 vs. LTA and LPS co-stimulation group at days 3 and 7. LTA, lipoteichoic acid; LPS, lipopolysaccharide.