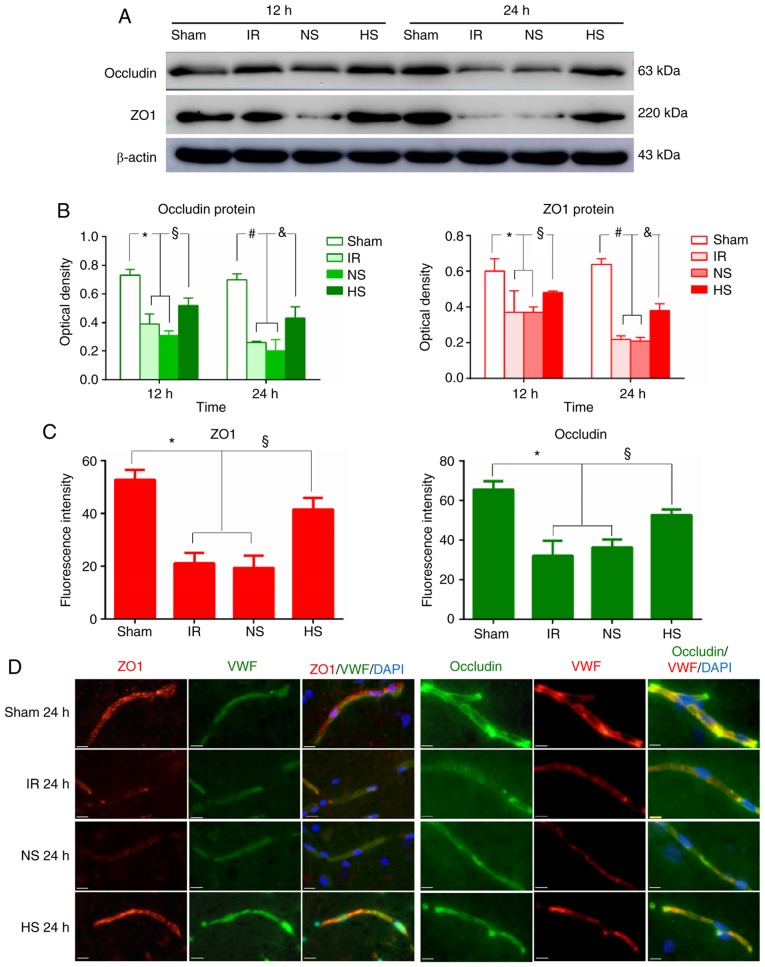
Figure 4.
Occludin and ZO1 protein expression in the peri-ischaemic brain tissue. (A) Representative images from western blot analysis for the proteins occludin (63 kDa), ZO1 (220 kDa) and β-actin (43 kDa). (B) Quantification of western blotting results in each experimental group at 12 and 24 h. §P<0.05 vs. IR at 12 h; &P<0.05 vs. IR at 24 h; *P<0.05 vs. sham at 12 h; and #P<0.05 vs. sham at 24 h. (C) Fluorescence intensity changes of ZO1 and occludin proteins in each group 24 h after treatment. §P<0.05 vs. IR; and *P<0.05 vs. sham. (D) Representative images (scale bar, 5 µm). ZO1, zonula occludens 1; IR, ischaemia-reperfusion; NS, normal saline; HS, hypertonic saline; VWF, von Willebrand factor.

