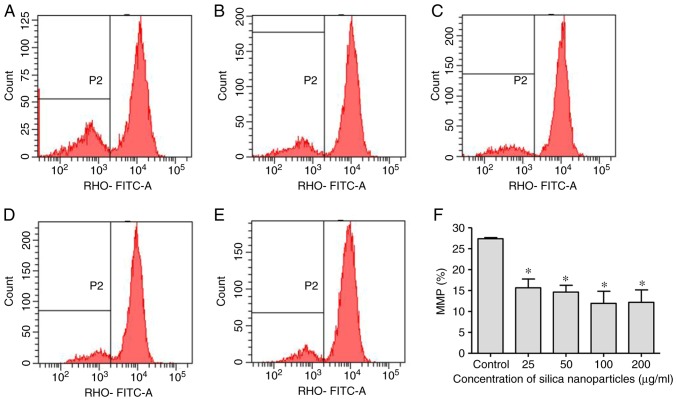
Figure 4.
Effects of SNs on the MMP of HL-7702 cells. Evaluation of the MMP of (A) control-treated HL-7702 cells, and cells treated with (B) 25, (C) 50, (D) 100 and (E) 200 µg/ml SNs for 24 h. The vertical axis indicates the number of cells and the horizontal axis indicates the MMP. (F) Quantification of the effects of SN treatment on the MMP as determined via flow cytometry. *P<0.05 vs. control. MMP, mitochondrial membrane potential; RHO, Rhodamine 123; SN, silica nanoparticles.

