Figure 6.
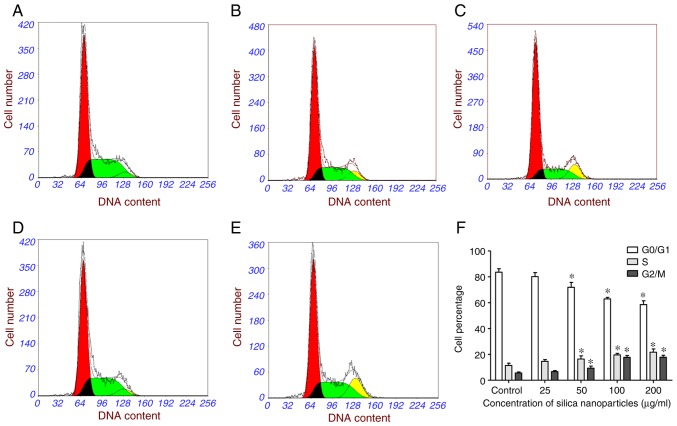
Cell cycle arrest in HL-7702 cells treated with SNs. Cell cycle analysis of (A) control-treated HL-7702 cells, and cells treated with (B) 25, (C) 50, (D) 100 and (E) 200 µg/ml SNs for 24 h. (F) Quantification of the effects of SN treatment on the cell cycle distribution as determined via flow cytometry. *P<0.05 vs. control. SN, silica nanoparticles.

