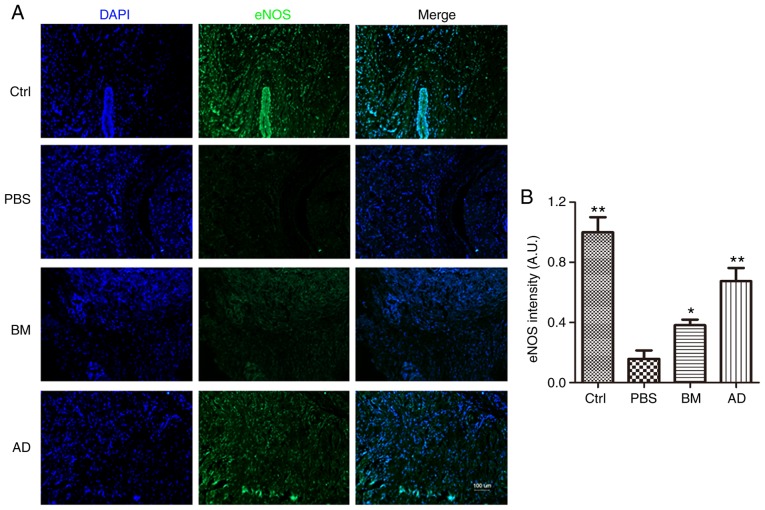
Figure 4.
Immunofluorescence staining to detect eNOS expression. (A) The expression of eNOS decreased in the PBS group, while ADSC treatment and BMSC treatment exerted obvious and significant restorative effects on eNOS expression. Scale bar=100 µm. (B) Quantitative analysis of eNOS expression in cavernous tissue was performed using an image analyzer. Each bar depicts the mean ± standard deviation values from 5 animals per group. *P<0.05 and **P<0.01 compared with the control (Ctrl) group. ADSC, adipose-derived stem cell; BMSC, bone marrow-derived stem cell; PBS, phosphate-buffered saline; BM, BMSC-treated group; AD, ADSC-treated group; eNOS, endothelial nitric oxide synthase.

