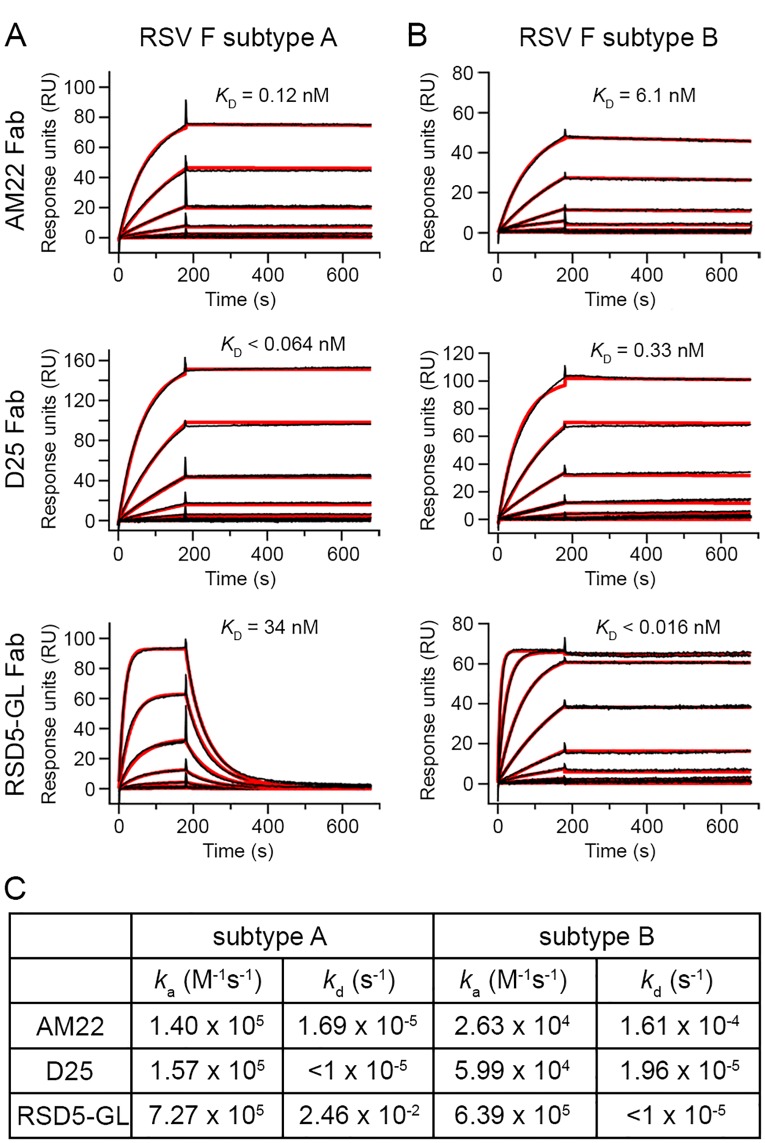
Fig 1. Kinetic parameters of AM22, D25, and RSD5-GL antibodies binding to prefusion RSV F.
Surface plasmon resonance (SPR) sensorgrams of AM22, D25, and RSD5-GL Fabs binding to prefusion RSV F from (A) subtype A (strain A2) or (B) subtype B (strain B9320). The raw data is plotted as a black line and the fitted curve used to calculate the binding kinetics is plotted as a thicker red line. Each binding curve has a 180 second association phase, followed by a 500 second dissociation phase. The equilibrium dissociation constant (KD) is displayed immediately above the SPR curve for each Fab. (C) A table of the association rate constants (ka) and dissociation rate constants (kd) determined for the binding kinetics of each Fab. A value of <1 x 10⁻⁵ was used as the lower limit for the dissociation rate constant (kd) that can be accurately measured by a Biacore X100.

