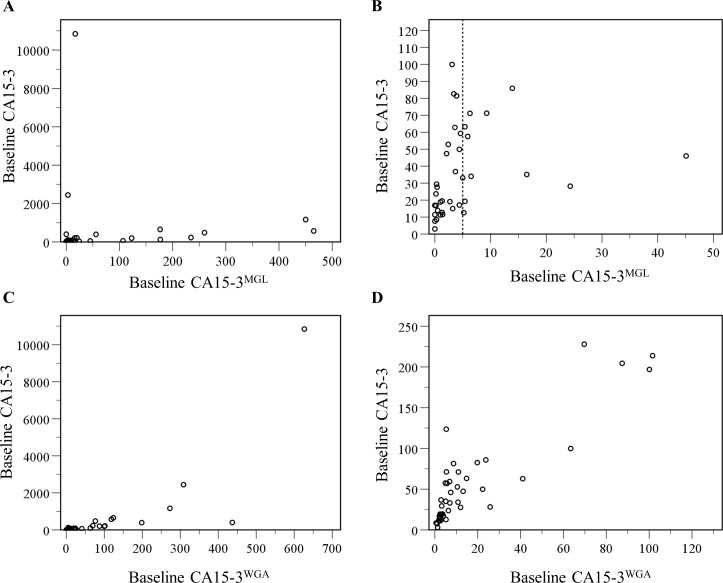
Fig 4. Correlation of the conventional CA15-3 and CA15-3Lectin assays.
A: Scatterplot of baseline conventional CA15-3 levels and baseline CA15-3MGL levels in metastatic breast cancer patients. r = 0.68, p<0.001 B: Enlargement of the scatterplot for the patients with the lowest CA15-3 levels for both conventional CA15-3 and CA15-3MGL. Very low baseline CA15-3MGL levels < 5 U/mL were observed in 29 patients (44.6%), dashed vertical line at x-axis C: Scatterplot of baseline conventional CA15-3 levels and baseline CA15-3WGA levels in metastatic breast cancer patients. r = 0.90, p<0.001. D: Enlargement of the scatterplot for the patients with conventional CA15-3 < 250 U/mL and CA15-3WGA < 130 U/mL, 85% of the study patients.

