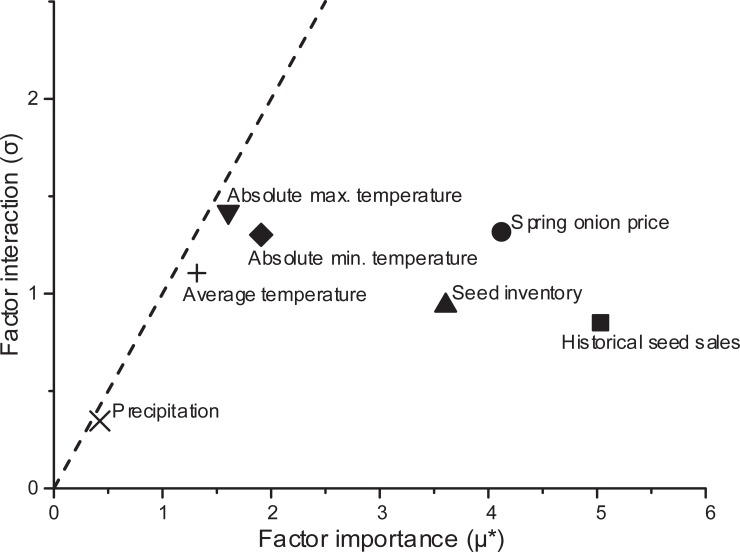
Fig 4. Analysis of the influence and interaction between dynamic factors using the Morris method.
The horizontal axis is the mean absolute value of the elementary effect (μ*), which represents the influence of a factor on output. The vertical axis is the standard deviation (σ), which represents the interaction of a factor with other factors. The dashed line σ = μ* represents point at which interaction with other factors equals the influence on output.

