Figure 3.

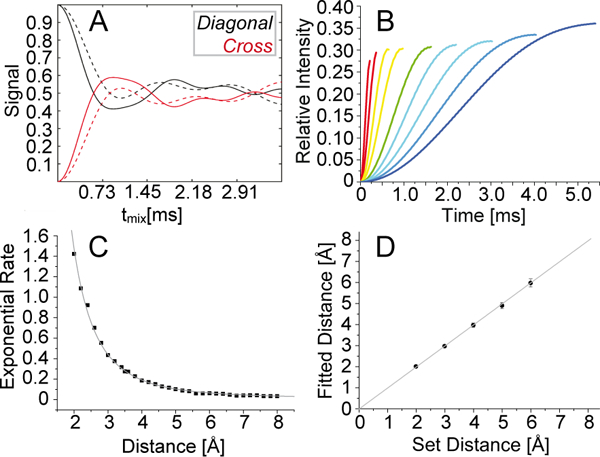
Validation of simplified fitting using two-spin simulations. (A) Simulated diagonal-peak intensity (black) and cross peak buildup (red) for a proton-proton spin pair of 3 Å distance, assuming only the first-order term (dashed line) or taking into account higher-order terms (solid line). (B) Simulated initial-regime buildups (including higher order terms) for the proton-proton distances of 2.0, 2.4, 2.8, 3.2, 3.8, 4.2, 4.6, 5.0 and 5.4 Å. (C) Depiction of extracted buildup rates as obtained for various distances by simple mono-exponential fitting of simulations (black symbols). The distance dependence of the fit parameter matches a calibrated r−3 function (gray) with a correlation coefficient R2 of 0.99. (D) Verification of the fitting procedure of eNORA2 modified for RFDR using simulated buildup and decay curves. Simulations for 2 to 6 Å were used as the “experimental” input to verify the fitting procedure. Determined distances and distances set for the simulation correlate linearly.
