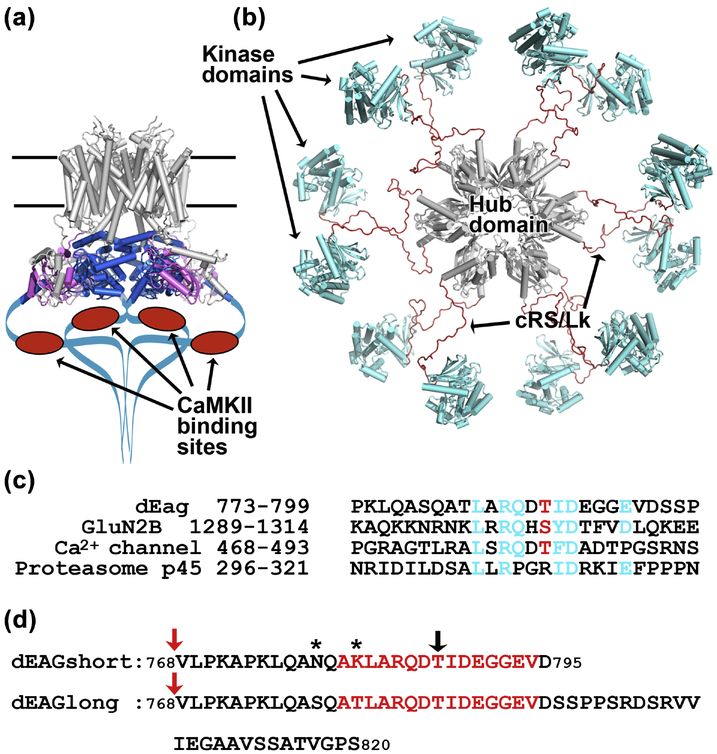
Figure 1: Cartoon representations of EAG channel and CaMKII kinase.
a) Cryo-EM structure of the rat EAG channel (PDB: 5K7L). Membrane buried regions of channel are in grey at the top, PAS domain in magenta and CNBh domain in blue, C-terminal regions not observed in the structure are drawn as a blue line with CaMKII recognition sequence indicated as red oval. b) Pseudo-atomic EM model of the dodecameric CaMKII kinase (PDB: 5U6Y), probably corresponding to an activatable state18 with hub domain in grey at the center and kinase domains in blue tethered to the hub domain by brown cRS/Lk (C-terminal end of Regulatory Segment - residues 300–314, plus Variable Linker - residues 315–344); cRS/Lk region was not observed in the experimental determination of this structure. c) Amino acid alignment of the CaMKII recognition sequences in dEAG and in the NMDA receptor GluN2B subunit with similar sequences in the L-type voltage-dependent Ca2+ channel (GenBank: EAW60557.1) and 26S proteasome subunit p45 (GenBank: BAA07919.1). Sequences in the Ca2+ channel and p45 protein were found by PHI-BLAST search. In cyan are shown dEAG residues that interact with kinase domain (see main text and Figure 3) and homologous residues in the other sequences. Phosphorylatable residue is shown in red. d) Sequence of dEAG channels fragments used in this study. Residues highlighted in red correspond to sequence of channel fragment visible in crystal structures. Black arrow indicates T787, the residue that is phosphorylated by CaMKII. Stars indicate residues mutated in dEAGshort. Red arrows indicate position of MBP fusion.

