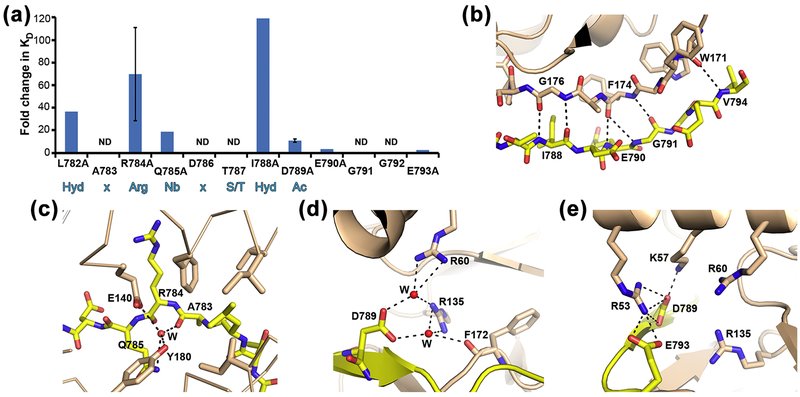
Figure 4: Determinants of the interaction between channel fragment and kinase.
a) Bar graph representing changes in interaction stability (measured as KD) between kinase domain and mutants of dEAGlong channel fragment. Fold change of mutant KD relative to wild type is shown together with dEAG sequence. Standard deviation for mutants R784A and D789A is shown as error bars. Sequence positions marked ND (not determined) are included to allow comparison with optimal sequence motif for a CaMKII substrate shown in blue below graph: Hyd-x-Arg-Nb-x-Ser/Thr-Hyd-Ac; Hyd: hydrophobic, x: any residue, Nb: non-basic, Ac: acidic.. b) Main-chain hydrogen bond network established between dEAG and CaMKII is shown as dashed lines; c) and d) Water (W) mediated interactions between atoms in dEAG A783, Q785 and D789 with kinase domain are shown as dashed lines. e) Electrostatic cluster in CaMKII kinase/dEAG structure. Dashed lines indicate hydrogen bonding interactions but all positively charged residues are within 6 Å of negatively charged residues.

