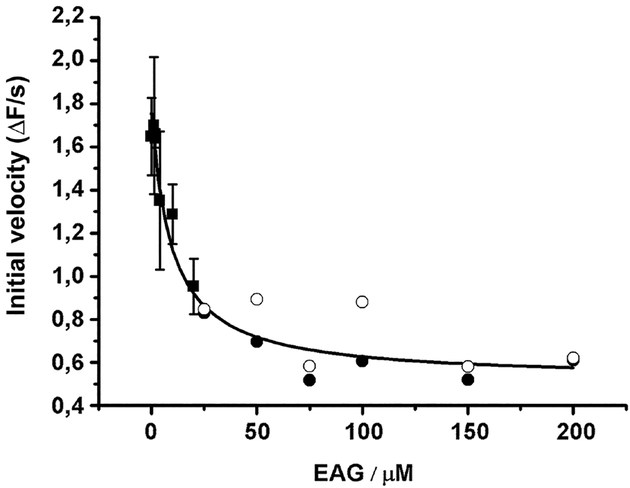
Figure 5: Impact of phosphorylation of dEAG fragment on interaction with kinase.
Plot of initial velocity of ATP hydrolysis catalyzed during phosphorylation of syntide-2 (at an initial concentration of 250 μM) in the presence of increasing dEAG concentrations. IC50 determined from curve fit is ~9 μM. In this coupled assay, ADP produced by the kinase is used in a parallel reaction with pyruvate kinase/lactate dehydrogenase to oxidize NADH, whose consumption results in a decrease of 340 nm absorbance. Points corresponding to more dilute concentrations of MBP-dEAGshort (≤20 μM) were measured in triplicate (mean ± SD shown), and those corresponding to higher concentrations of channel fragment were measured in duplicate (individual measurements are shown). Curve fitted to data is indicated in the material and methods section.

