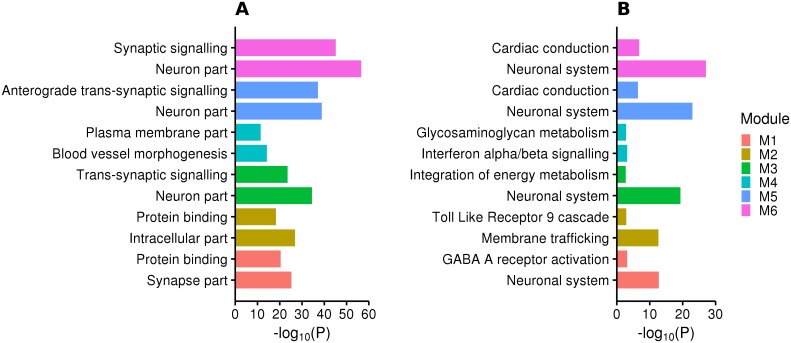
Fig 2. Pathway analysis of major depression enriched modules.
A competitive gene pathway analysis was performed on tissue-specific significant gene co-expression modules using g:Profiler (https://biit.cs.ut.ee/gprofiler/index.cgi). The figure shows the (A) gene ontology and (B) biological pathways of tissue-specific modules enriched with major depression gene-based signals.

