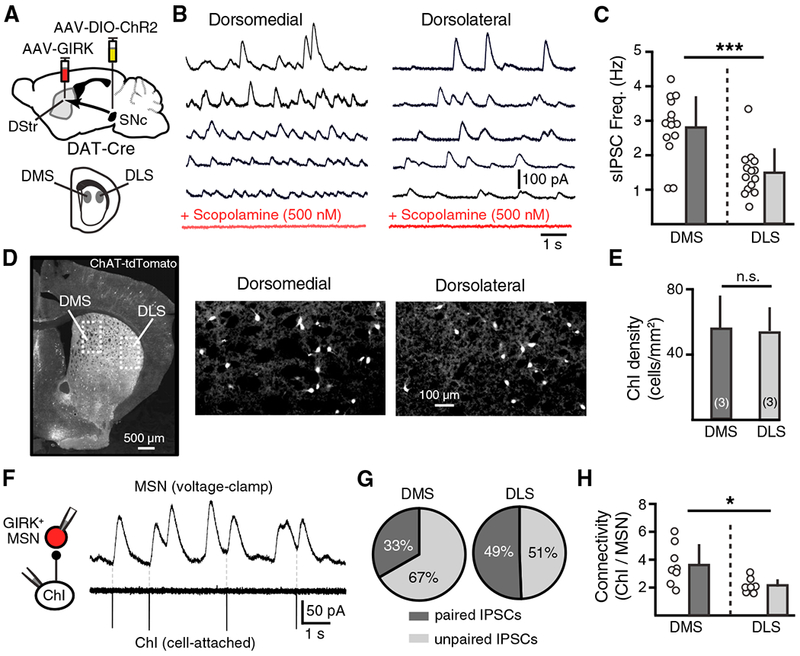
Figure 5. Regional Differences in Cholinergic Transmission and Connectivity between ChIs and dMSNs at Muscarinic Synapses.

(A) Schematic of injection of AAV-GIRK2-tdTomato to the dorsal striatum and AAV-DIO-ChR2 to the midbrain of DAT-Cre mice.
(B) M4-sIPSCs from GIRK2+ (Kir3.2+) dMSNs in the DMS and DLS in the control condition (black) and in scopolamine (500 nM, red).
(C) Summary M4-sIPSC frequencies in DMS and DLS dMSNs.
(D) Left: widefield image of the coronal striatal section from Chat-tdTomato mice showing tdTomato fluorescence. Right: zoomed in view of the inset for DMS and DLS.
(E) ChI densities (number of ChIs per square millimeter) in the DMS or DLS as counted by widefield fluorescence.
(F) Representative traces of paired recordings showing APs in the ChI trigger time-locked (paired) IPSCs in the paired MSN.
(G) Averaged percentage of paired and unpaired IPSCs in one ChI-MSN pair in the DMS or DLS.
(H) Connectivity of ChIs to MSNs, illustrating the number of ChIs connected to one dMSN in the DMS or DLS.
Error bars represent SEM. *p < 0.05, ***p < 0.001.
