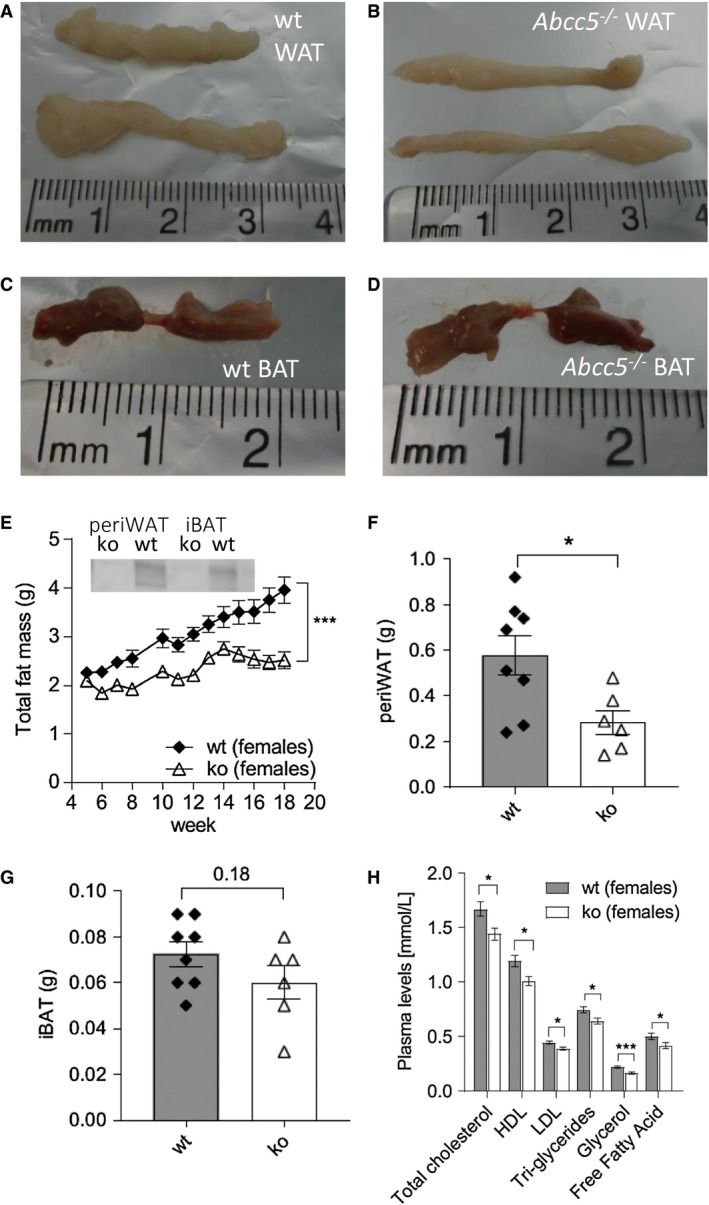
Figure 2.

Female white adipose tissue (WAT) and brown adipose tissue (BAT) depots. (A) Representative image of wild‐type (wt) periovarian WAT (periWAT). (B) Representative image of Abcc5‐/‐ periWAT. (C) Representative image of wt interscapular BAT (iBAT). (D) Representative image of Abcc5‐/‐ iBAT. (E) Total fat mass. Each data point represents mean ± SEM. Changes in total fat mass over time for Abcc5‐/‐ vs. wt were analyzed by two‐way ANOVA with a Bonferroni post hoc test; ***P ≤ 0.001. Insert shows Western blot analysis of ABCC5 protein expression in adipose tissue. Lanes 1 and 2, periWAT from female Abcc5‐/‐ mice and female wt mice, respectively; lanes 3 and 4, iBAT from female Abcc5‐/‐ and female wt mice, respectively. (F) Mass of periWAT and (G) mass of iBAT; wt, n = 8; Abcc5‐/‐, n = 6 animals. (H) Lipid plasma levels for female Abcc5‐/‐ mice (n = 14) and female wt mice (n = 15). Data shown as mean ± SEM; Welch's unequal variances t test; *P < 0.05; ***P < 0.001. [Color figure can be viewed at wileyonlinelibrary.com]
