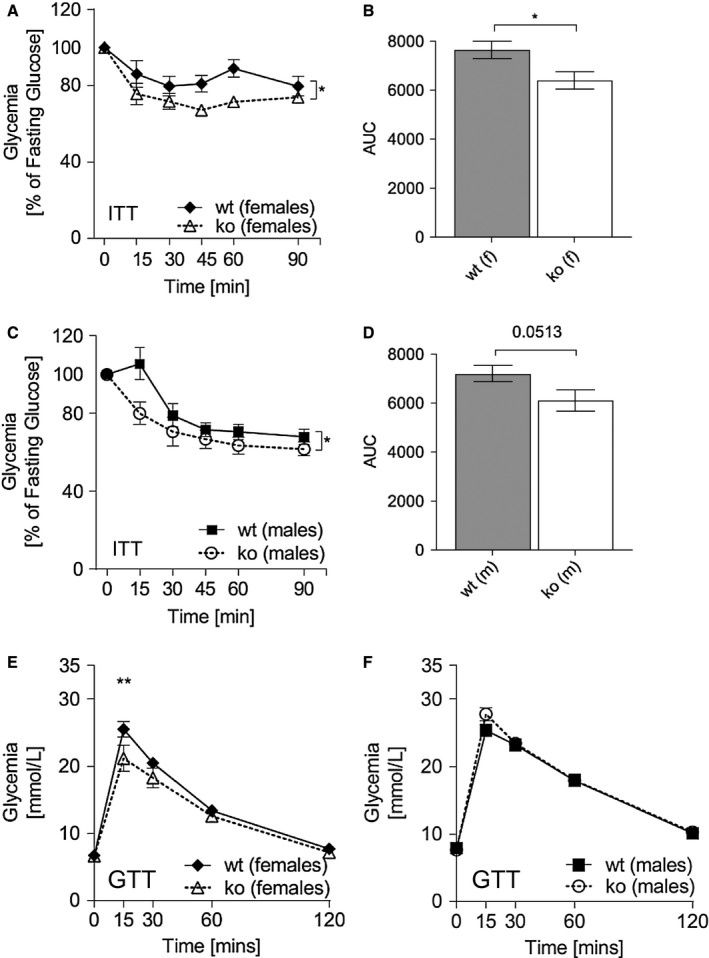
Figure 6.

Abcc5‐/‐ mice show increased insulin sensitivity. Insulin tolerance test (ITT) for (A,B) female and (C,D) male mice. ITT was performed on mice aged 14 weeks; male:female:wild‐type (wt):Abcc5‐/‐ = 15:15:15:14. Data shown as mean ± SEM. Changes in plasma glucose in response to intraperitoneal insulin over time for Abcc5‐/‐ vs. wt were analyzed by two‐way ANOVA with a Bonferroni post hoc test. Area under the curve (AUC) was analyzed by an unpaired two‐tailed Student t test; *P < 0.05. Intraperitoneal glucose tolerance tests (GTT) on 13‐week‐old (E) female and (F) male mice (male:female:wt:Abcc5‐/‐ = 15:15:15:14). Data shown as mean ± SEM. Changes in plasma glucose in response to intraperitoneal glucose over time for Abcc5‐/‐ vs. wt were analyzed by multiple comparison two‐way ANOVA with a Bonferroni post hoc test; **P < 0.01.
