
Figure 7.
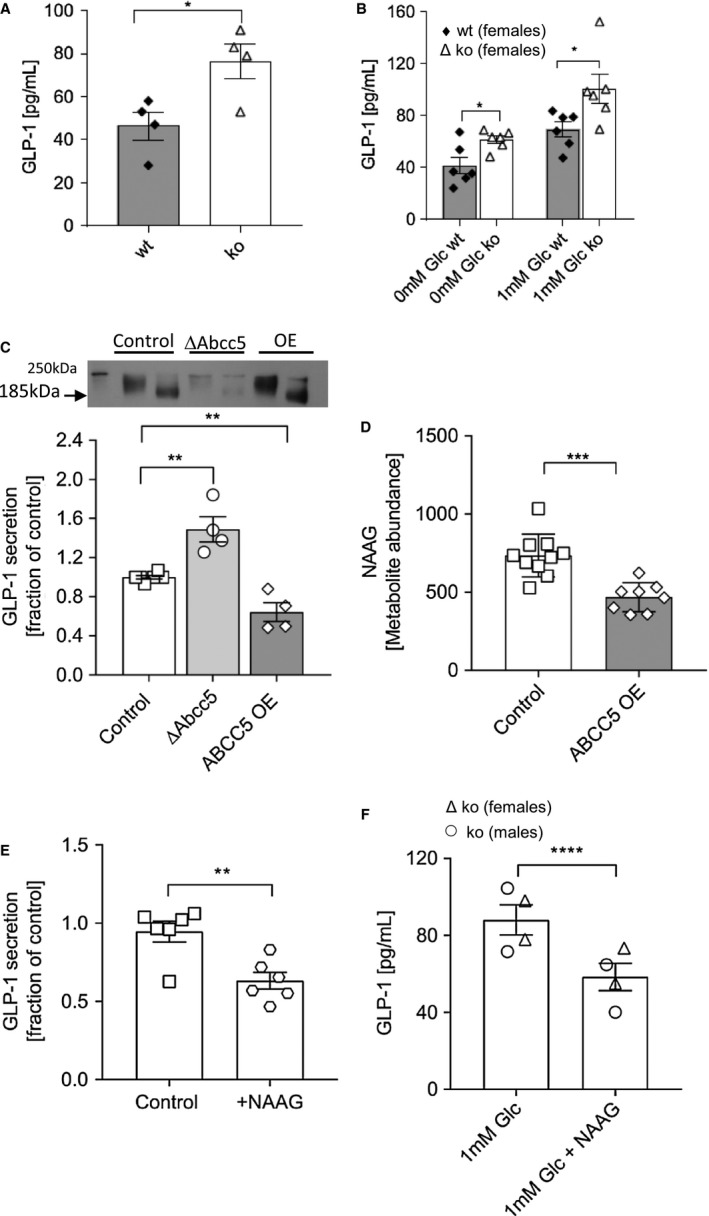
GLP‐1 exocytosis is dependent on ABCC5 protein levels. (A) Abcc5‐/‐ mice (n = 4, female, open bar) had increased circulating levels of total plasma GLP‐1 when compared with wild‐type (wt) littermates (n = 4, female, filled bar) at 5 minutes following a fasted glucose challenge. (B) Active GLP‐1 secretion from ex vivo gut crypt primary cell cultures was increased in Abcc5‐/‐ mice (n = 6, female, open bar) compared with wt littermates (n = 6, female, filled bar) in both the absence (0mM Glc) and presence of glucose (1mM Glc). (C) Total GLP‐1 secretion from GLUTag cells following a 2‐hour incubation in 5.6mM glucose (open squares, n = 6) showed increased GLP‐1 release from Abcc5 siRNA treated GLUTag cells (open circles, n = 6), while overexpression (OE) of ABCC5 protein attenuated GLP‐1 release (open diamonds, n = 4). Data presented as a fraction of GLP‐1 secreted in 5.6mM (control) glucose. Data for panels A‐C shown as mean ± SEM and were analyzed by an unpaired Welch’s unequal variances t test; *P ≤ 0.05; **P ≤ 0.01. Insert is Western blot analysis of ABCC5 protein expression in wt GLUTag cells (lane 1, unheated sample; lane 2, heated sample), siRNA knockdown of Abcc5 gene expression (lane 3, unheated sample; lane 4, heated sample), and recombinant OE of ABCC5 protein (lanes 5, unheated sample; lane 6, heated sample). ABCC5 typically migrates on an SDS‐PAGE gel at a molecular weight of 185 kDa in heated samples and at a higher molecular weight of about 200 kDa in unheated samples. (D) ABCC5 OE (open diamonds) decreased levels of NAAG in GLUTag cells when compared with control (open squares); control, n = 10; ABCC5 OE, n = 8. (E) Exogenous NAAG inhibited secretion of GLP‐1 from GLUTag cells (open hexagons, n = 6) when compared with control (open squares, n = 6) in the presence of 1mM glucose. Data for panels D and E shown as mean ± SEM and were analyzed by an unpaired two‐tailed Student t test; **P ≤ 0.01; ***P ≤ 0.001. (F) Exogenous NAAG inhibited secretion of GLP‐1 from ex vivo gut crypt primary small intestine cultures of Abcc5‐/‐ mice (n = 4); ****P ≤ 0.0001; unpaired Welch’s unequal variances t test. Error bars: mean ± SEM.