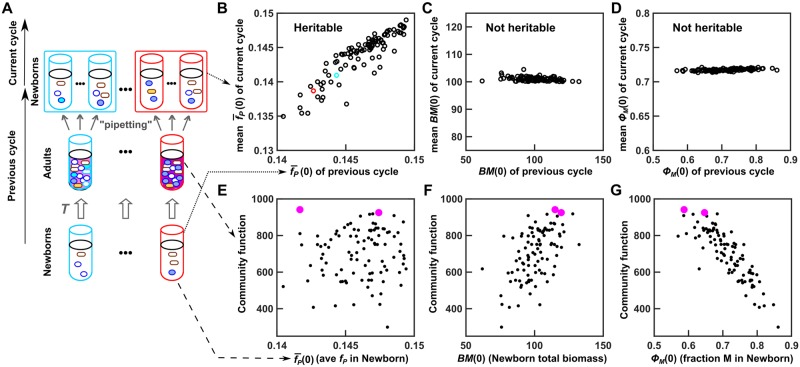
Fig 4. During ineffective community selection, community function correlates weakly with its heritable determinant and strongly with nonheritable determinants.
(A) Schematic of community lineages across “previous” and “current” selection cycles. (B-G) Data of Newborns and corresponding Adults (previous cycle) were taken from the 180th cycle of the simulation displayed in black in Fig 3A and 3B. We then allowed each Adult to reproduce Newborns (current cycle), forming 100 lineages (tubes with the same color outline belong to the same lineage). (B–D) Among the 3 determinants of community function, (fP averaged among M cells in Newborn) is heritable, but BM(0) (total biomass of Newborn) and ϕM(0) (fraction of M biomass in Newborn) are not. For each lineage, the community function determinant at the previous cycle was scatter plotted against the average value at the current cycle. (E–G) During ineffective community selection (Fig 3B), community function P(T) correlates weakly with heritable determinant but strongly with nonheritable determinants. Each dot represents one community. Magenta dots: "successful" Newborns that achieved the highest community function at adulthood and therefore were chosen to reproduce in the top-dog strategy. The Matlab code for B–D can be found in S2 Code, and the data for E–G can be found in S1 Data. Adult, Adult community; M, Manufacturer; Newborn, Newborn community.

