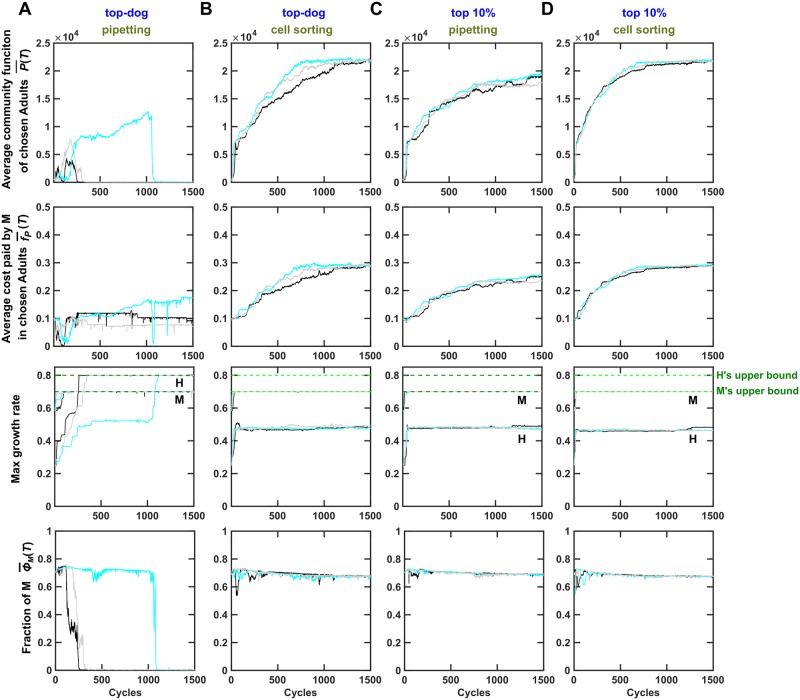
Fig 6. Effective community selection can encourage species coexistence.
Here, the evolutionary upper bound for gHmax () was larger than that for gMmax (), opposite to that in Figs 2–5. (A) When the top-dog strategy and pipetting were used to choose and reproduce Adult communities, M was almost outcompeted by H as H evolved to grow faster than M (rows 3 and 4). Although M would ordinarily go extinct, community selection managed to maintain M at a very low level (bottom). This imbalanced species ratio resulted in very low community function (top). (B-D) When community selection was effective, using top-dog with cell sorting (panel B), top-tier with pipetting (panel C), or top-tier with cell sorting (panel D), community selection successfully improved community function and . In these cases, H’s growth parameter did not increase to its evolutionary upper bound (panel B-D row 3, also see S17B–S17D Fig), allowing a balanced species ratio (panel B-D bottom) and high community function (panel B-D top). Resource supplied to Newborn communities here supports 105 total biomass to accommodate faster growth rates (and hence community function is larger than in other figures). Black, cyan, and gray curves represent independent simulation trials. (average community function) and (average fraction of M biomass in Adult communities) were averaged across the chosen Adults. was obtained by first averaging among M within each chosen Adult and then averaging across all chosen Adults. The simulation codes can be found in S4 Code, and the data can be found in S3 Data. Adult, Adult community; H, Helper; M, Manufacturer.

