. 2019 Jul 16;8:e46050. doi: 10.7554/eLife.46050

Figure 4. Effects of CNO on learning rate and randomness in action selection.

(a) Learning rate (α) and randomness in action selection (β), estimated from behavioral data during the TAB task, were compared between DMSO and CNO sessions (means ± SEM across animals). (b) Top, trial-by-trial action values during the initial 15 trials after block transition. Bottom, mean (± SEM across animals) action values in the dynamic state. (c) Top, trial-by-trial action values during the last 10 trials of a block. Bottom, mean (± SEM across animals) action values in the steady state. Gray circles and connecting lines, individual animal data. Asterisks indicate the results of Bonferroni post-hoc tests (*p<0.05; **p<0.01; ***p<0.001) for those measures with significant mouse line × drug interaction (Intx) effects (two-way mixed-design ANOVA).
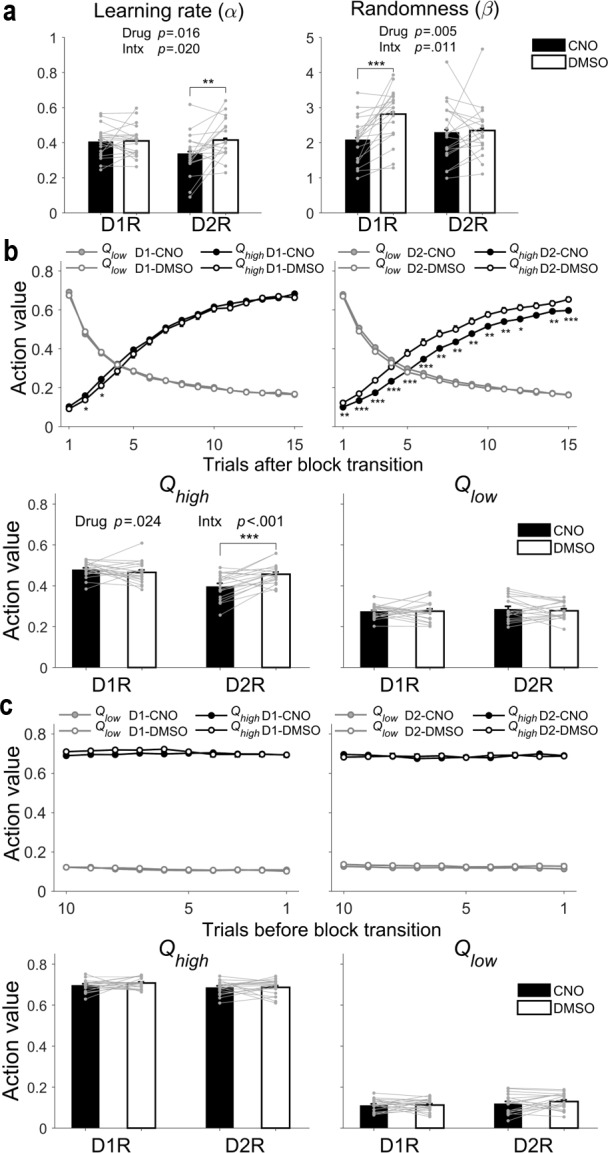
Figure 4.

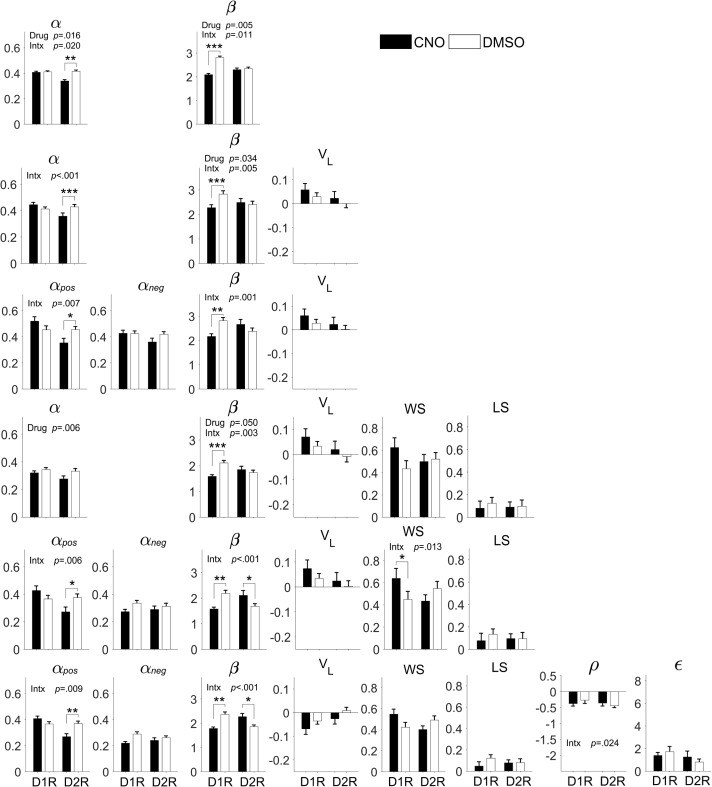
Figure 4—figure supplement 1. Consistent results were obtained using variants of the Q-learning model.

Figure 4—figure supplement 1.

Coefficients (means ± SEM across animals) of model parameters are shown for models 1–6 (see Materials and methods). In all models, CNO significantly increased randomness in action selection in D1R-Cre mice and significantly decreased learning rate in D2R-Cre mice. Left, D1R-Cre mice; right, D2R-Cre mice. α, learning rate; αpos, learning rate for positive outcome (rewarded trials); αneg, learning rate for negative outcome (unrewarded trials); β, randomness in action selection; VL, choice bias; WS, win-stay; LS, lose-switch; ε and ρ, parameters for uncertainty-based exploration (see Materials and methods). P-values are indicated for those measures with significant main effects of drug and/or mouse line × drug interaction (Intx) effects (two-way mixed-design ANOVA). Asterisks indicate the results of Bonferroni post-hoc tests (*p<0.05; **p<0.01; ***p<0.001).