. 2019 Jul 25;8:e44838. doi: 10.7554/eLife.44838

Figure 7. Prefrontal neurons dynamically code risk with other behaviorally important variables.

(A) Neuronal reward history-to-risk transition. A single DLPFC neuron with fixation-period activity that initially reflected whether reward was received from a particular choice on the last trial (‘Last reward × choice’) before reflecting current-trial object risk. Coefficients of partial determination (partial R2) obtained from sliding-window multiple regression analysis. The observed single-neuron transition from recent reward history to current object risk is consistent with the behavioral model in Figure 3C which constructs and updates object-risk estimates from reward experience. (B) Numbers of neurons with joint and separate coding of object risk and history variables that were relevant for risk updating (including last-trial reward, last-trial choice, last-trial reward × last trial choice). Numbers derived from sliding window analyses focused on early trial periods relevant to decision-making (trial start until 500 ms post-cue). (C) Neuronal value-to-risk integration. A single DLPFC neuron with fixation-period activity encoding both object risk and object value, compatible with the notion of integrating risk and object value into economic utility. (D) Number of neurons with joint and separate coding of risk and value. (E) Neuronal risk-to-choice transition. A single DLPFC neuron with activity encoding object risk before coding object choice, consistent with decision-making informed by risk. (F) Numbers of neurons with joint and separate coding of object risk and object choice. (G) Cumulative coding latencies of history variables, object risk, object value, and object choice. Latencies derived from sliding-window regression (first sliding window for which criterion for statistical significance was achieved, see Materials and methods; cumulative proportion of significant neurons normalized to maximum value for each variable). (H) Regression coefficients for neurons with joint risk coding and choice coding (left) and joint risk coding and value coding (right). (I) Proportion of neurons with joint coding and pure coding of specific task-related variables (left) and proportion of neurons coding different numbers of additional variables (right).

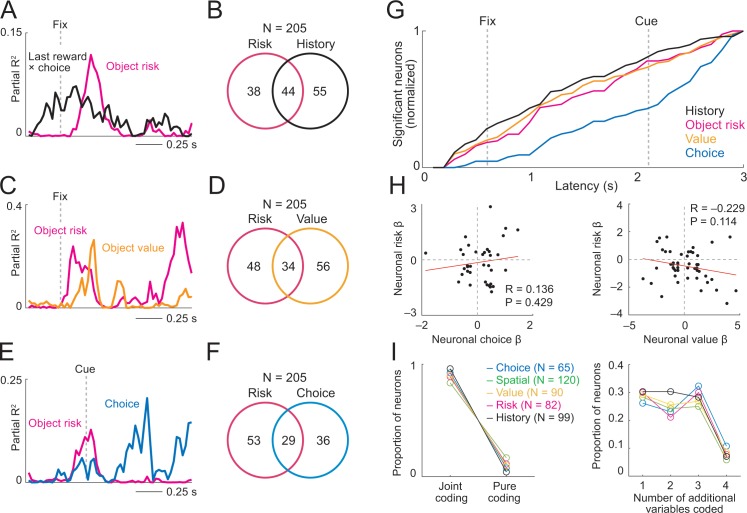
Figure 7—source data 1.
DOI: 10.7554/eLife.44838.029

Figure 7.

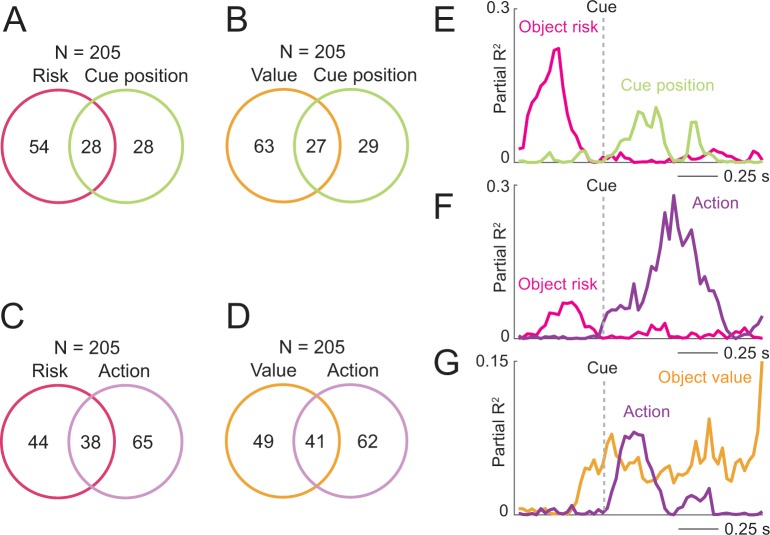
Figure 7—figure supplement 1. Coding of risk and value jointly with spatial variables.

Figure 7—figure supplement 1.

(A) Numbers of neurons with joint and separate coding of object risk and left-right cue position. Numbers derived from sliding window analyses (Equation 11). (B) Numbers of neurons with joint and separate coding of object value and left-right cue position. (C) Numbers of neurons with joint and separate coding of object risk and left-right action. (D) Numbers of neurons with joint and separate coding of object value and left-right action. (E) Single neuron transitioning from pre-cue object-risk coding to cue-position coding. (F) Single neuron transitioning from pre-cue object-risk coding to action coding. (G) Single neuron transitioning from pre-cue object-value coding to action coding.
Figure 7—figure supplement 1—source data 1.
DOI: 10.7554/eLife.44838.026
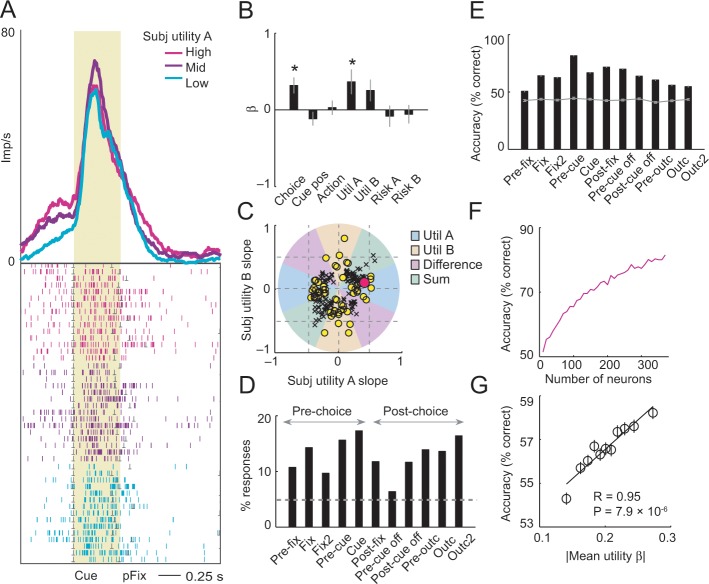
Figure 7—figure supplement 2. Utility control.

Figure 7—figure supplement 2.

(A) A single DLPFC neuron encoding the utility associated with object A at the time of choice (cue period). Utility was defined as the weighted linear combination of object value (based on reward history) and object risk, with weighting coefficients derived from individual animals’ choices (Figure 3E). (B) In a multiple regression, utility for object A explained a significant proportion of variance in impulse rate (p=0.025, t-test). (C) Categorization of coding utility for objects A or B, utility difference or utility sum based on the angle of coefficients. Red circle: neuron from A and B. (D) Percentages of utility-coding neuronal responses across all task epochs (based on multiple regression), calculated with respect to 1222 task-related responses from 205 neurons. (E) Population decoding of utility from unselected neurons. Decoding accuracy (% correct classification) for utility based on a linear support-vector-machine classifier (N = 161 neurons). Leave-one-out cross-validated decoding for utility was significantly above chance (gray line, decoding from shuffled data) in all task epochs (p<0.0001; Wilcoxon test). (F) Decoding performance increased with the number of neurons, late fixation period. Data for each neuron number show mean (± s.e.m) over 100 iterations of randomly selected neurons. (G) Relationship between neuronal utility decoding and individual neuron’s utility sensitivities. Linear regression of decoding performance from 5000 subsets of 20 randomly selected neurons on average utility sensitivity (single-neuron utility regression slope).
Figure 7—figure supplement 2—source data 1.
DOI: 10.7554/eLife.44838.028