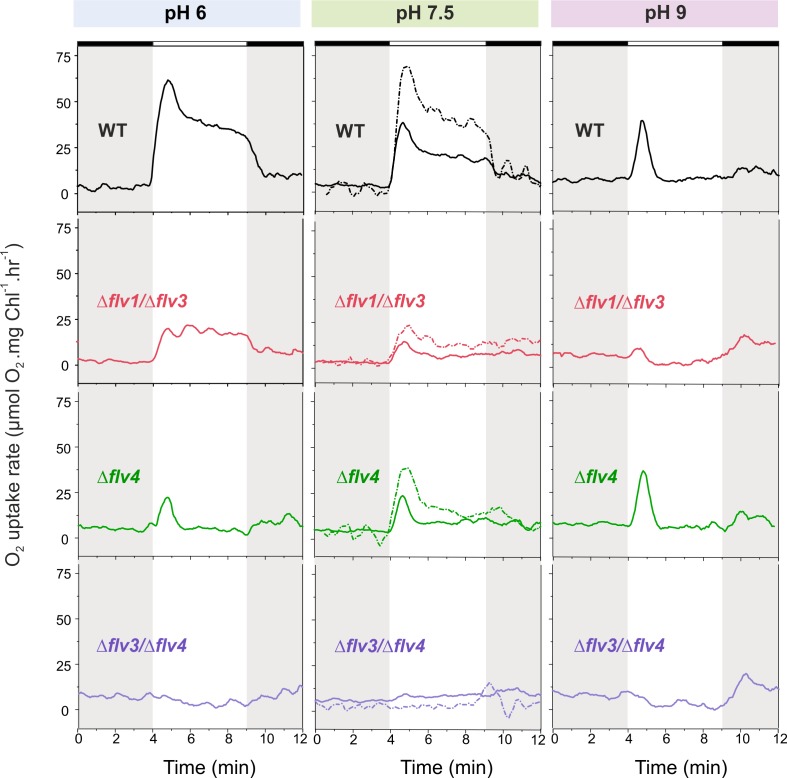
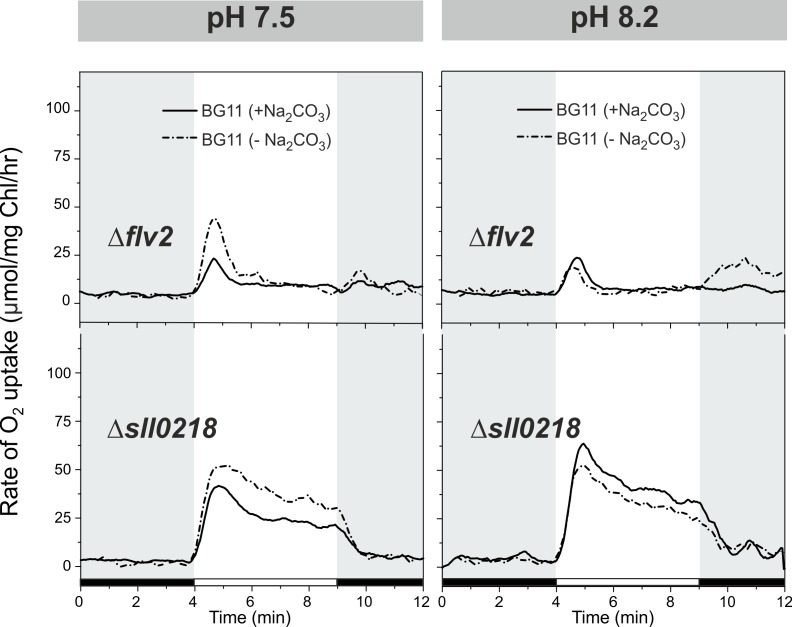
Figure 2. O2 reduction rates of WT and FDP mutants grown at different pH levels.
O2 reduction rate was recorded in darkness (gray background) and under illumination with actinic white light at an intensity of 500 µmol photons m−2 s−1 (white background). Pre-cultures were grown in standard BG-11 medium (containing Na2CO3 at a final concentration of 0.189 mM) under HC for 3 days at different pH levels. For MIMS experiments, cells were shifted to LC at OD750≈0.2 (same pH) and grown for 4 days before measurements. Exceptions were: (i) pH 6 experimental cultures were inoculated from pH 8.2 pre-cultures; and (ii) pH 7.5 pre-culture was shifted to LC in standard BG-11 containing Na2CO3 at a final concentration of 0.189 mM or in BG-11 without Na2CO3 (dotted line ‘- Na2CO3’). The experiment was conducted in three independent biological replicates (except experiment at pH 6 with n = 2 independent biological replicates) and a representative plot is shown. (Figure 2—source data 1). In order to create comparable conditions for MIMS measurements, all cells were supplemented with 1.5 mM NaHCO3 prior to the measurements.


