. 2019 Jul 11;8:e45766. doi: 10.7554/eLife.45766

Figure 5. Rates of O2 reduction in response to increasing light intensity in WT, ∆flv1/flv3 and ∆flv4 mutant cells (A, B, C, respectively).

O2 reduction rate was recorded in darkness (gray background) and under illumination with actinic white light intensities of 500, 1000 and 1500 µmol photons m−2 s−1 (white background). In order to create comparable conditions for MIMS measurements, all cells were supplemented with 1.5 mM NaHCO3 prior to the measurements. Pre-cultures were grown in BG-11 medium (pH 7.5) under 3% CO2 (HC) for 3 days and then shifted to LC (atmospheric 0.04% CO2 in air) at OD750 = 0.2 and pH 7.5 for 4 days. For MIMS measurements, cells were harvested and resuspended in fresh BG-11 medium at a Chl a concentration of 10 µg mL−1. (D) Maximum rate of light-induced O2 uptake (O2 µmol mgChl a−1 hr−1) of WT, ∆flv1/flv3 and ∆flv4 mutant cells at different light intensities applied. The experiment was conducted in three independent biological replicates and a representative plot is shown (Figure 5—source data 1).

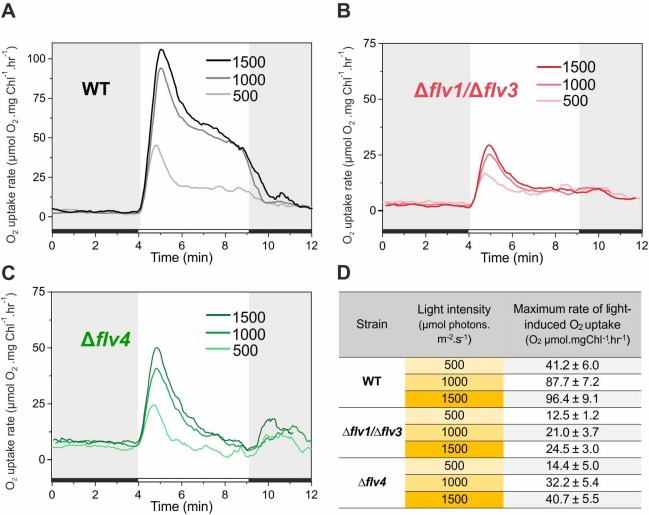
Figure 5—source data 1. Rates of O2 reduction in response to increasing light intensity in WT, ∆flv1/∆flv3 and ∆flv4 mutant cells.
DOI: 10.7554/eLife.45766.019

Figure 5.

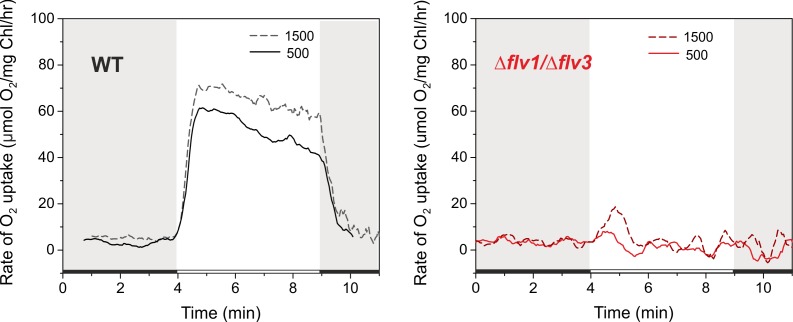
Figure 5—figure supplement 1. Rates of O2 reduction in response to increasing light intensity in WT and ∆flv1/∆flv3 mutant cells grown under 3% CO2 (HC).

Figure 5—figure supplement 1.

O2 reduction rate was recorded in darkness (gray background) and under illumination with actinic white light intensities of 500 and 1500 µmol photons m−2 s−1 (white background). Cells were grown under 3% CO2 (BG-11, pH 8.2), harvested and resuspended in fresh BG-11 at Chla 10 ug/ml for MIMS measurements.
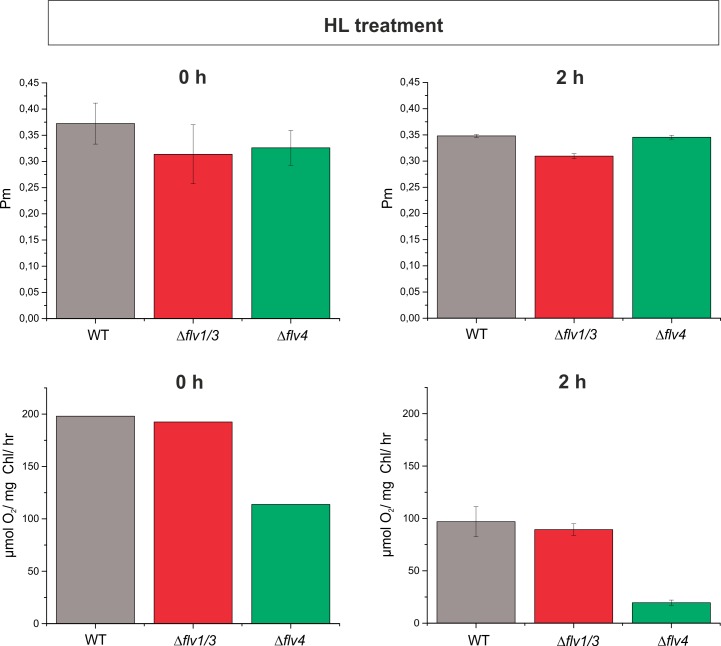
Figure 5—figure supplement 2. The maximum oxidisable amount of P700 (Pm) and PSII activity of the WT, ∆flv1/flv3 andflv4 mutant cells.

Figure 5—figure supplement 2.

Cells were grown in BG-11 (pH 7.5) and shifted from HC to LC for 4 d and illuminated with 50 µmol photons m−2s−1. Prior to the HL treatment, Chl a concentration was set to 10 µgmL-1. Measurements were made in dark-adapted samples after 0 hr and 2 hr of HL treatment (1500 µmol photons m−2 s−1). The PSII oxygen evolving activity was in measured in the presence of 0.5 mM DMBQ under 1000 µmol photons m−2s−1 white illumination. Pm was determined under far red illumination by applying a strong white pulse (5000 µmol photons m−2 s−1). Data are represented as mean of 2 biological replicates (± SD).