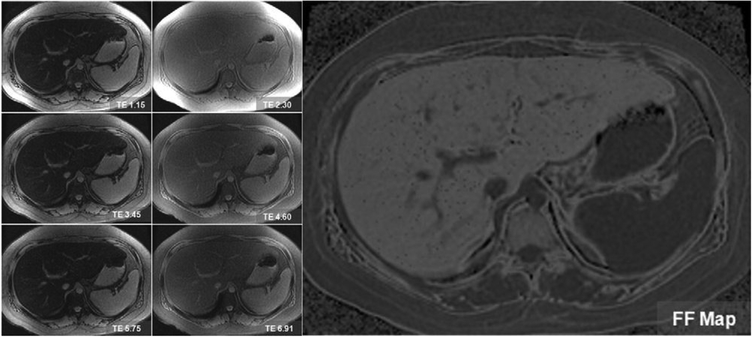
Figure 5.
Spectrally modeled relaxation-invariant MR technique performed on a 53-year-old man with fatty liver disease. Source images (left panels) are obtained at serial out-of-phase and in-phase echo times. A low flip angle is used to reduce T1 effects. A synthetic fat fraction map (right) is generated from the source images by measuring and correcting for T2* and modeling fat-fat interference effects. Note that the intrahepatic blood vessels and spleen are dark on the fat fraction map because these structures are devoid of fat.

