Figure 4.
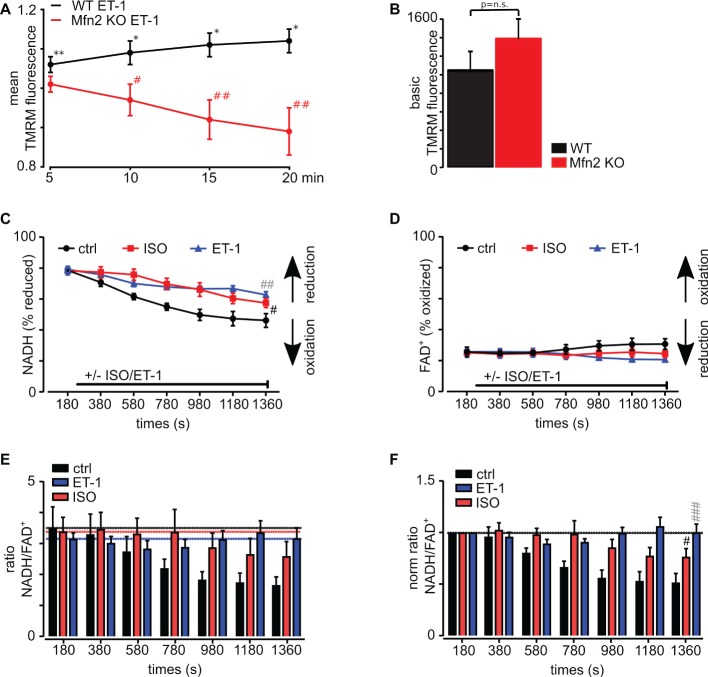
IP3R stimulation with ET-1 increases mitochondrial membrane potential in WT myocytes but not in Mfn2 KO myocytes. (A) Normalized mean values of TMRM fluorescence changes in WT (black line) and Mfn2 KO (red line) cardiac myocytes after exposure to 10 nM ET-1 for 20 min. TMRM signal was normalized to the level measured in untreated WT and Mfn2 KO myocytes. (B) Mean values of basal TMRM fluorescence in untreated myocytes from WT (black) and Mfn2 KO (red) mice. (C) Mean values of NADH in % of reduced NADH following ISO (red) and ET-1 (blue) treatment as well as untreated control (black) over 20 min. (D) Mean values of FAD+ in % of oxidized FAD+ following ISO (red) and ET-1 (blue) treatment as well as untreated control (black) over 20 min. (E) The ratio of NADH/FADH following the treatment with ET-1 (blue) and ISO (red). For comparison, untreated control is shown in black. (F) The normalized ratio of NADH/FADH following treatment with ET-1 (blue) and ISO (red) is shown. Black is the untreated control with electrical field stimulation at frequency 0.5 Hz. (A) *p ≤ 0.05 compared to untreated control, **p ≤ 0.001 compared to untreated control, #p ≤ 0.05 compared to WT treated with ET-1, ##p ≤ 0.001 compared to WT treated with ET-1. (C–F) #p ≤ 0.05, ##p ≤ 0.01, ###p ≤ 0.001; black – ISO vs. ctrl, gray – ET-1 vs. ctrl.

