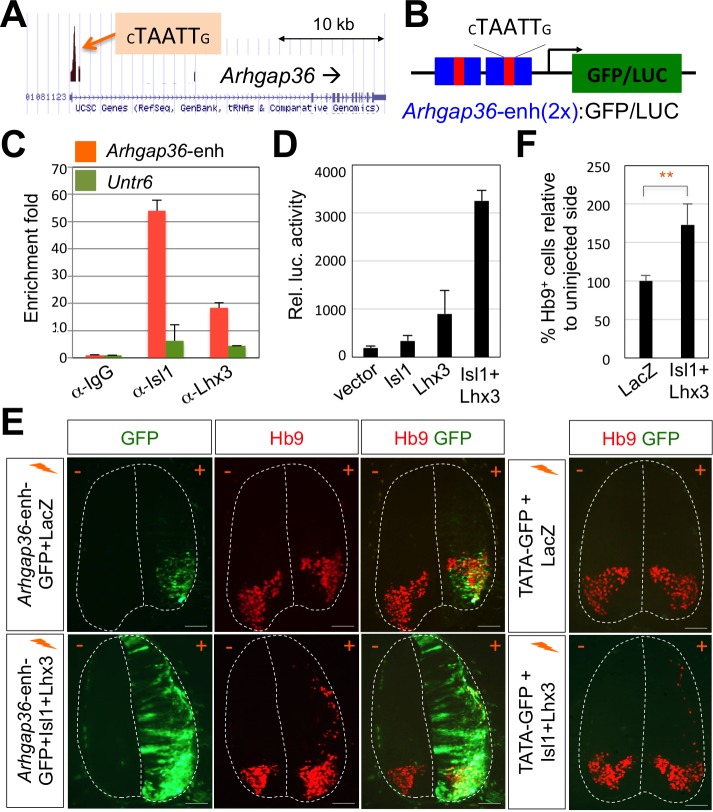
Figure 4. ChIP-seq peaks for the Isl1-Lhx3 complex in Arhgap36 and their in vivo recruitment of the Isl1-Lhx3 complex.
(A) Isl1-Lhx3 complex binding sites in Arhgap36. The peak has HxRE motif. (B) A schematic representation of reporter constructs linked to two copies of Arhgap36-enhancer genomic DNA fragment. (C) Both Isl1 and Lhx3 were recruited to Isl1-Lhx3-bound ChIP-seq peak in Arhgap36 gene. ChIP was performed with anti-IgG antibody (control), anti-Isl1 and anti-Lhx3 antibodies using E12.5 mouse embryonic spinal cord extracts. Quantitative PCR amplification of the binding region of Arhgap36 and negative control region, Untr6. ChIP experiments were repeated independently twice. Data are presented as the mean of duplicate values and error bars represent standard deviation. (D) Luciferase assay for a reporter directed by two copies of Arhgap36-enhancer. Transfections were repeated independently at least three times. Data are presented as the mean of triplicate values and error bars represent standard deviation. (E) In ovo electroporation of LacZ (to measure electroporation efficiency) and a GFP reporter directed by two copies of Arhgap36-enhancer without or with co-expression of Isl1 and Lhx3. TATA-GFP vector with no HxRE was used as a negative control and this reporter was not activated even when Isl1 +Lhx3 expression induces ectopic MNs in dorsal spinal cord. Each set of DNA was injected and electroporated in chick neural tube and embryos (n = 5 ~ 10) were harvested 3 days post electroporation (three dpe). Hb9 staining labels endogenous and ectopically induced motor neurons in the spinal cord. +, electroporated side, –, non-electroporated side. White dotted lines indicate the outline of the spinal cord. Experiments were repeated independently at least three times. Scale bars: 100 μm. (F) Quantification of the number of Hb9+ cells relative to uninjected side of the spinal cord. Data are mean ± s.d. **p<0.001 (Student’s t-test). n = 5 ~ 8 independent images per each sample.

